
By James Barnett
Declining enrollment is an issue that has plagued schools across America for the greater part of the last decade. While various factors are likely to be at fault, declining birth rates, especially in states that encompass portions of the nation’s largest metropolitan areas, are one large factor leading to the phenomenon. In New Jersey in particular, the count of live births dropped from 106,922 in 2010 to 97,954 in 2020, marking an 8.4% decrease in just ten years.[i] In roughly the same amount of time, the state’s population has increased 5.5%.[ii] This puts New Jersey at the fourteenth lowest among states for live birth rates, according to the U.S. Census Bureau’s Population and Housing Unit Estimates Program.[iii]
Concurrently, enrollment in public schools has declined over the last ten years and is projected to decline at an even faster rate in the coming decade. According to the National Center for Education Statistics (NCES), New Jersey schools experienced a 2% decrease in enrollment from Fall 2010 to Fall 2021, and an additional 7% drop is projected to occur between Fall 2021 and Fall 2031.[iv] This could present a problem for New Jersey schools, given that funding for schools from both state and local sources is calculated on a per-pupil basis. In other words, the fewer the pupils enrolled, the fewer the dollars budgeted for teacher’s salaries, supplies, building overhead costs, and more.[v]
Figures 1 and 2 below present year-over-year changes in both K-12 public school enrollment and total population in the state, which clearly do not display a straight-line divergence for either measure. Particularly for the enrollment numbers, the effect of the COVID-19 pandemic, which hit during the latter half of the 2019-2020 academic year, is accentuated. In just one year, total enrollment in all New Jersey public schools dropped from 1,375,829 to 1,362,400 students. There are a number of possible motivating factors that may have led to parents withdrawing their children during this unprecedented time—concerns regarding pandemic restrictions and/or exposure to the virus, dissatisfaction with changes to curriculum, or other additional burdens placed on students whose parents had to continue working through the pandemic.
Interestingly, not all NJ schools saw drops in enrollment. In the Newark City School District (which is majority-minority in makeup and overwhelmingly low-income), enrollment grew by 4,000 students from 2019 to 2021.[vi] In the nearby (much smaller) South Orange-Maplewood district, this number conversely declined by 400 students.
The inconsistency between these two sampled districts corresponds to contrasting statewide enrollment changes between certain demographics during this same time range: “Including charter school enrollment, the number of White students in public schools statewide dropped by 39,000, and the number of Asian students fell by 2,400. Black enrollment climbed 900, and the number of Latino students grew by 20,100.”[vii]
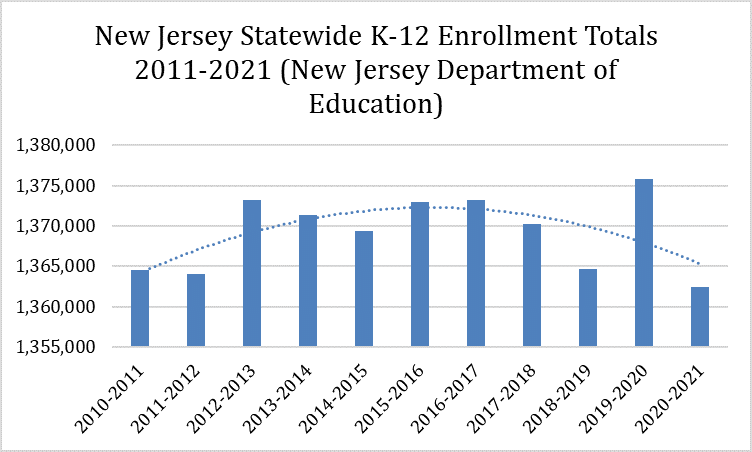
Figure 1[viii]
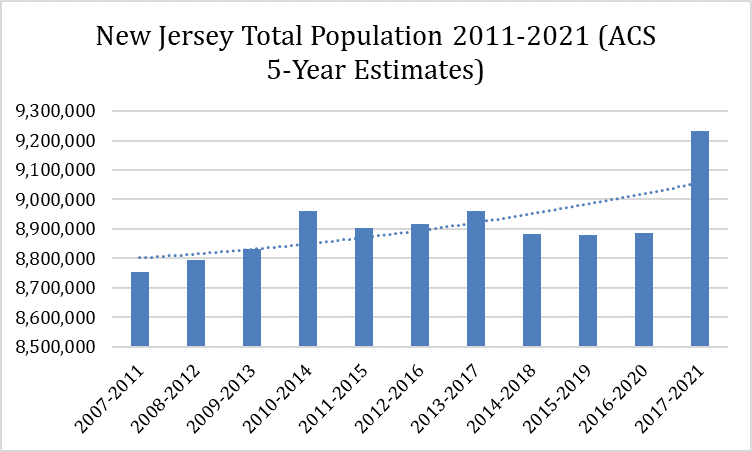
Figure 2[ix]
To understand these enrollment trends and their true fiscal impact on each New Jersey public school district, it is evident that research must delve into a more granular level, taking into account a greater multitude of demographic variables.
James Barnett is a graduate student in the Edward J. Bloustein School of Public Planning and Policy at Rutgers University. He is working toward a Master of City and Regional Planning degree in 2024.
References:
[i] “Fertility Rate: New Jersey, 2010-2020.” March of Dimes Peristats. March of Dimes, January 1, 2022. https://www.marchofdimes.org/peristats/data?reg=99&top=2&stop=1&lev=1&slev=4&obj=8&sreg=34.
[ii] “Tables.” Social Explorer. Social Explorer, Accessed June 9, 2023. https://www.socialexplorer.com/explore-tables.
[iii] Stebbins, Samuel. “How New Jersey’s Birth Rate Compares to the Nation.” The Center Square New Jersey. The Center Square, January 19, 2022. https://www.thecentersquare.com/new_jersey/how-new-jersey-s-birth-rate-compares-to-the-nation/article_5b1f0a27-7d91-5f4c-b599-920567b727e8.html.
[iv] “Public School Enrollment.” National Center for Education Statistics. U.S. Department of Education, Institute of Education Sciences, May 1, 2023. https://nces.ed.gov/programs/coe/indicator/cga/public-school-enrollment#:~:text=Between%20fall%202010%20and%20fall,million%20students%20in%20fall%202020.
[v] “School Finance 101.” New Jersey School Boards Association. New Jersey School Boards Association, Accessed June 7, 2023. https://www.njsba.org/news-information/parent-connections/school-finance-101/.
[vi] Nieto-Munoz, Sophie. “Public School Enrollment Dropped 18K since Start of Pandemic, State Data Shows.” New Jersey Monitor. New Jersey Monitor, May 20, 2022. https://newjerseymonitor.com/2022/05/20/public-school-enrollment-dropped-18k-since-start-of-pandemic-state-data-shows/#:~:text=Overall%2C%20enrollment%20at%20New%20Jersey’s,not%20seen%20across%20all%20demographics.
[vii] Ibid.
[viii] “Fall Enrollment Reports.” Official Site of the State of New Jersey. New Jersey Department of Education, Accessed June 7, 2023. https://www.nj.gov/education/doedata/enr/.
[ix] “Tables.” Social Explorer. Social Explorer, Accessed June 9, 2023. https://www.socialexplorer.com/explore-tables.
[x] “Percentage of Births by Race: New Jersey, 2018-2020 Average.” March of Dimes Peristats. March of Dimes, January 1, 2022. https://www.marchofdimes.org/peristats/data?reg=34&top=2&stop=9&lev=1&slev=4&obj=3&sreg=34.