
Tia Azzi and Michael Lahr, Rutgers Economic Advisory Service (R/Econ™)
Introduction
This is the third brief that reports data on New Jersey from the 2020 decennial census. The first presents a summary dataset that R/Econ™ produced for the New Jersey State Policy Lab in the form of readily accessed spreadsheets.[1] The second examines differences between 2020 population estimates and the final census count as well as on population change over the prior decade for counties and municipalities in the state.[2] This one focuses on the density of population by county and municipality, as well as on changes in racial/ethnic minority populations. Population density has many implications to policy and planning. Because people in densely populated tend to interact with each other more often, population density can activate problems (e.g., crime) and positive opportunities (e.g., the exchange and sharing of ideas). Crucially, New Jersey is the most densely populated state in the nation;[3] it also is one of the most ethnically/racially diverse.[4] It also remains one of the most racially and ethnically segregated states.[5] This brief strictly focuses on two of the state’s largest minority populations: 1) non-Hispanic Black or African American, and 2) Hispanic or Latino. Working with the U.S. Bureau of the Census data, which largely relies upon respondents’ self-identification of a limited set of races and ethnicities, we abbreviate non-Hispanic Black and African-American codification to “non-Hispanic Black,” and Hispanic and Latino to “Latinx,” the nonbinary form of Latino or Latina.
County Regions
In other work for the New Jersey State Policy Lab and based on migration trends, we have established five regions of New Jersey: the Highlands, North Jersey, Central Jersey, South Jersey, and the Shore. The Highlands counties consist of Sussex, Warren, and Hunterdon. South Jersey counties consist of Salem, Cumberland, Gloucester, Camden, and Burlington. Central Jersey consists of Mercer, Middlesex, Monmouth, and Somerset counties. North Jersey consists of Bergen, Essex, Hudson, Morris, Passaic, and Union counties. The Shore consists of Atlantic, Ocean, and Cape May counties. We use these regions to help us summarize trends in this brief.
Population Density
Based on the decennial census, New Jersey had 9,228,994 inhabitants in 2020.[6] North Jersey and Camden County were the most densely populated counties in the state. Counties of the Highlands were among the least densely populated in the state. Following the population count itself, the Shore tended to remain only slightly more densely populated than parts of the state that border the Delaware River estuary, Camden, Gloucester, and Mercer counties notwithstanding. See the first half of Figure 1.
Figure 1: Population Density by County and Municipality, 2020
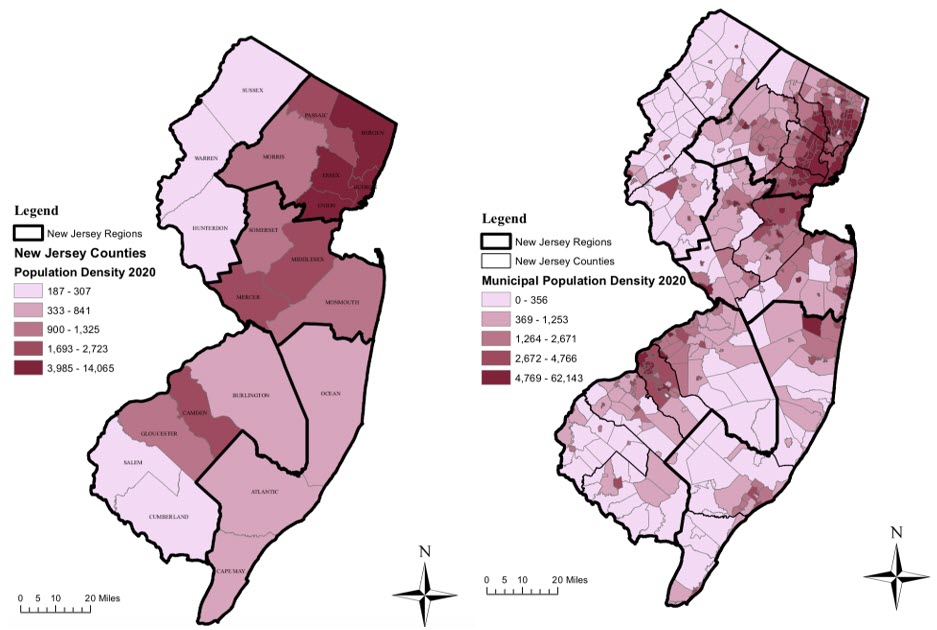
The second half of Figure 1 depicts the population density by New Jersey municipality (with outlines for both counties and regions). The least densely populated municipalities are in the Highlands and in the Pinelands, the core of which straddles southern Burlington County and northwestern Atlantic County. The New Jersey municipalities with the highest population densities—i.e., Guttenberg Town (Hudson County), Union City (Hudson County), West New York Town (Hudson County), Hoboken City (Hudson County), Cliffside Park Borough (Bergen County), and East Newark Borough (Hudson County)—tend to be across the Hudson River from Manhattan in the North Jersey. Camden City in Camden County, the twin city of Philadelphia, is also quite densely populated.
Non-Hispanic Black Population and Its Change from 2010 to 2020
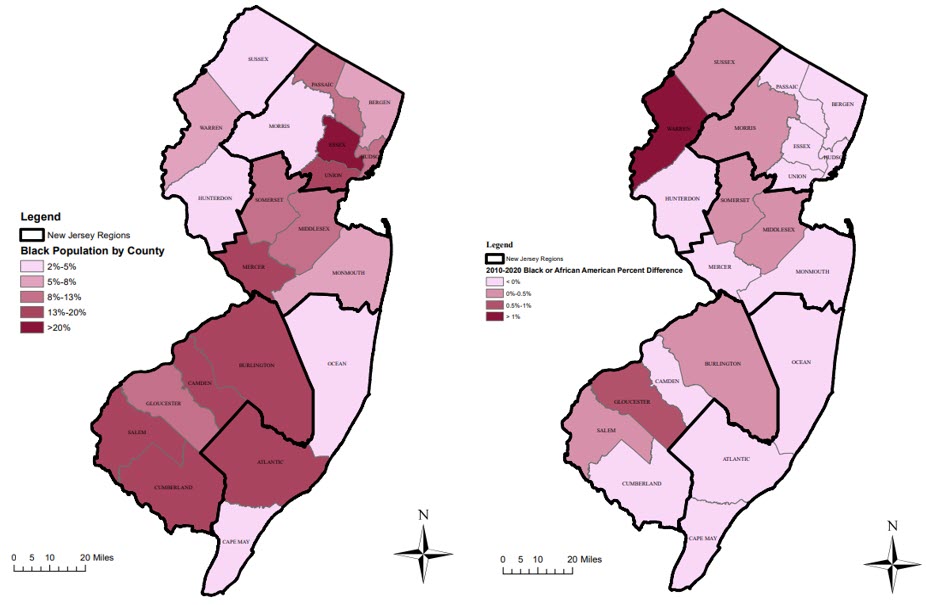
The non-Hispanic Black population grew by just 2.6 percent to 1,154,142 inhabitants over the decade or 12.4 percent of the state’s total population in 2020. This poses a 0.4 percentage point decline in its share from 2010. With a non-Hispanic Black population that comprises 37.5 percent of the population, Essex County in North Jersey is the only county in which that share exceeded 20 percent of the total. Other counties with concentrations of non-Hispanic Black population higher than the state’s average were limited to Union (19.5%), Mercer (18.7%), Camden (18.2%), Cumberland (17.1%), and Burlington (16.2%); the last three of which are in South Jersey. Shares of non-Hispanic Black populations by county tended to be lowest in the Highlands and in Cape May County, where the non-Hispanic Black population dropped by 22.1 percent to 3,305 inhabitants. Meanwhile, Warren County experienced a third decade of more than 50 percent growth in its non-Hispanic Black population; although in 2020, those 5,573 non-Hispanic Black inhabitants still constituted a modest 5.1 percent of that county’s population.
From 2010 to 2020, the change in Black residents’ shares of county populations changed narrowly, between -1.8 and 1.8 percentage points; Essex and Union counties, respectively, bounded the range. Naturally the range for municipalities was much larger +11.1 percent to -16.1 percent (see Appendix table A1.) Of municipalities with more than 5,000 non-Hispanic Black residents, Union Township in Union County had the greatest percentage increase in non-Hispanic Black population at 4.1 percentage points followed closely by Ewing Township in Mercer County at 3.7 percentage points. This enabled both municipalities to exceed concentrations of non-Hispanic Black residents of more than 30 percent for the first time. Meanwhile, the cities of Asbury Park (Monmouth County) and Plainfield (Middlesex County) suffered losses of more than 10 percentage points in their non-Hispanic Black population shares. As recently as the year 2000, non-Hispanic Black residents comprised about 60 percent of the population in these two places; they now comprise less than 35 percent. (See Appendix Figure A1 and Table A1.)
Figure 2: Non-Hispanic Black Population Shares 2020 and the 2010-2020 Percentage Change in Those Shares
Latinx Population and Its Change from 2010 to 2020
New Jersey’s Latinx population exceeded two million residents for the first time in 2020, making up about 21.6 percent of the state’s total population—up from 17.7 percent in 2010. Of the state’s 21 counties, 8 have Latinx populations that exceed that share: Passaic (42.7%), Hudson (40.4%), Cumberland (34.4%), Union (34%), Essex (24.4%), Middlesex (22.4%), Mercer (21.7%), and Bergen (21.4%). Among counties of North Jersey, only Morris County is not on that list. High shares of Latinx residents extend south down the Northeast Corridor to Middlesex and Mercer counties. Cumberland County’s large concentration of Latinx residents stands out in South Jersey. The Highlands round out things with the lowest concentrations of Latinx residents.
Figure 3: Latinx Population Shares 2020 and the 2010-2020 Percentage Change in Those Shares
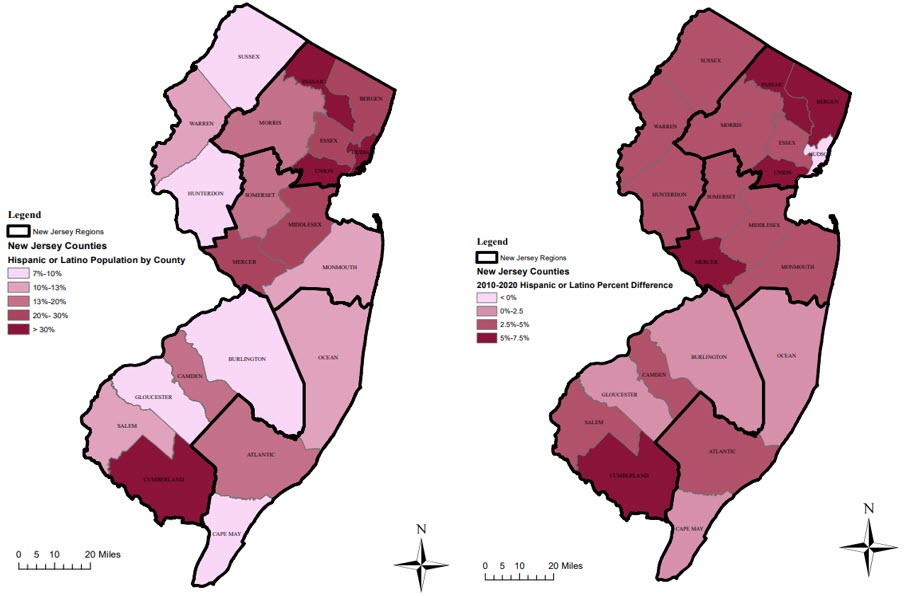
Unlike the non-Hispanic Black population, New Jersey’s Latinx population tended to enhance its population shares substantially over the past decade. By county, the change ranged between -1.8 and 7.4 percent points. Hudson County, which is second only to Passaic County in its concentration of Latinx residents and tops out with 293,019 Latinx inhabitants, was the lone county to experience a reduction in this population share. The rest of the counties in the North Jersey had at least a 2.5 percentage point rise. Notably, Cumberland County had the largest percentage increase in Latinx population. It was closely followed by Union, Mercer, and Passaic counties, which respectively experienced rises in Latinx concentrations of 6.6, 6.6, and 5.7 percentage points from 2010 to 2020.
Municipalities with Latinx populations of more than 5,000 inhabitants in 2020 that enhanced their concentrations of Latinx residents by more than 10 percentage points from 2010 to 2020 were Bridgeton (16.5 percentage points), Plainfield (14.2 percentage points), Lindenwold (12.1 percentage points), Fairview (12.0 percentage points), Trenton (11.3 percentage points), Lodi (10.9 percentage points), Belleville Township (10.8 percentage points), Ridgefield Park (10.6 percentage points), Pennsauken Township (10.5 percentage points), North Arlington Township (10.2 percentage points), and Freehold (10.2 percentage points). Note many of these municipalities are located along commuter and light rail lines. (See Appendix Figure A2 and Table A2.)
Conclusion
Most of the trends observed in this brief are not so new. Population in New Jersey remains densest along the Northeast Corridor between Manhattan and Philadelphia; and the state’s non-Hispanic Black population experienced another decade of near-stagnant growth. The biggest news is the continued rise of New Jersey’s Latinx population. Public transportation access to major cities both within and outside of the state appears to have been a prime lure, perhaps along with the quality of public schools.
Figure A1: Non-Hispanic Black Population Shares by Municipality, 2020
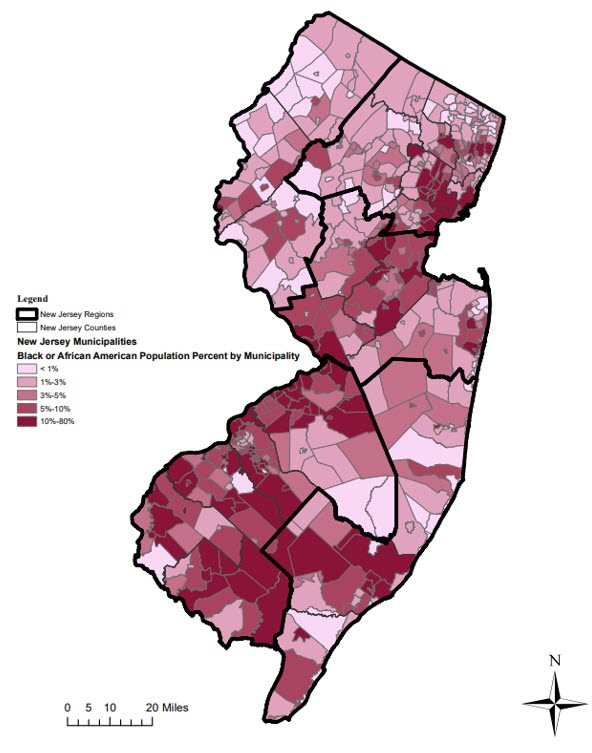
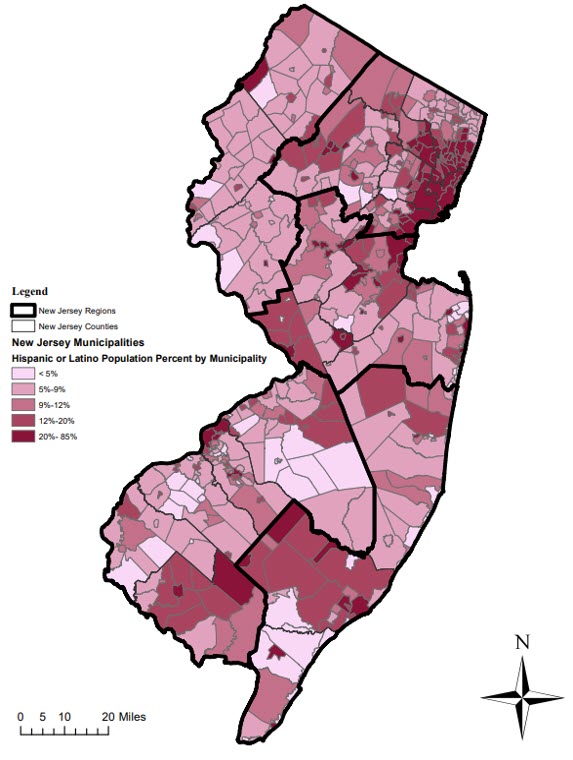
Figure A2: Latinx Population Share by Municipality, 2020
References
1 De la Calle, Maia and Michael L. Lahr. (2022). “A Multi-Decennial Census Data Set for NJ, 2010 and 2020 (and More): A New Jersey State Policy Lab Offering,” New Jersey State Policy Lab, Edward J. Bloustein School of Planning and Public Policy, March 26. Accessed April 20, 2022, at https://bloustein.rutgers.edu/njspl-multi-decennial-census-data-set/
2 Azzi, Tia and Michael L. Lahr. (2022). “Adjustments to Municipal and County Population Counts in New Jersey for 2020,” New Jersey State Policy Lab, Edward J. Bloustein School of Planning and Public Policy April 7. Accessed April 20, 2022, at https://policylab.rutgers.edu/adjustments-to-municipal-and-county-population-counts-in-new-jersey-for-2020/
[3] New Jersey Government. “State of NJ Profile,” NJ.gov, 2019, https://nj.gov/njoem/mitigation/pdf/2019/mit2019_section4_State_Profile.pdf. Accessed 13 April 2022.
[4] United States Census Bureau. “New Jersey: 2020 Census.” Census Bureau, 25 August 2021, https://www.census.gov/library/stories/state-by-state/new-jersey-population-change-between-census-decade.html. Accessed 16 April 2022.
[5] O’Dea, Colleen, and NJ Spotlight News. “Interactive Map: Segregation Continues to Be NJ’s State of the State.” NJ Spotlight News, 2 December 2016, https://www.njspotlightnews.org/2016/12/16-12-01-interactive-map-segregation-continues-to-be-nj-s-state-of-the-state/. Accessed 19 April 2022.
[6] U.S. Census Bureau. “NEW JERSEY: 2020 Census.” Census Bureau, 25 August 2021, https://www.census.gov/library/stories/state-by-state/new-jersey-population-change-between-census-decade.html. Accessed 13 April 2022.