
by Maia de la Calle, Rutgers Economic Advisory Service (R/ECON™)
Over the past two decades, children in New Jersey have been more afflicted by poverty than have adults. Growing up in poverty translates to higher exposure to economic deprivation, chronic exposure to stressors, inadequate nutrition, and limited educational opportunities, amongst other hardships. Research points to the negative consequences associated with child poverty, including higher prevalence of physical and cognitive impairments. Furthermore, high childhood poverty rates affect the state as a whole, resulting in inflated economic and social costs for all households in New Jersey (e.g., structural inequality, blighted neighborhoods, and high crime rates). And it perpetuates: a large body of research continues to emphasize how poverty transmits intergenerationally.[1] This piece examines the extent of child poverty in New Jersey, paying close attention to general trends, intra-state disparities, and variations across household structures.
In 2019, 14.0 percent of children in New Jersey lived in poverty, compared to 10.0 percent of the general population.[2] As shown in Table 1, the child poverty rate in the state increased from 1999 to 2010 (1.6 percent rise), and from 2010 to 2019 (1.4 percent rise). As of 2019, ten counties had an above-state-average child poverty rate: Passaic, Cumberland, Hudson, Essex, Salem, Atlantic, Camden, Ocean, Mercer, and Cape May—with the exception of Cape May, these are the same counties with above-state-average poverty rates for their general populations.
Table 1. Children living in poverty, 2019 by NJ Counties: count, rate, and change
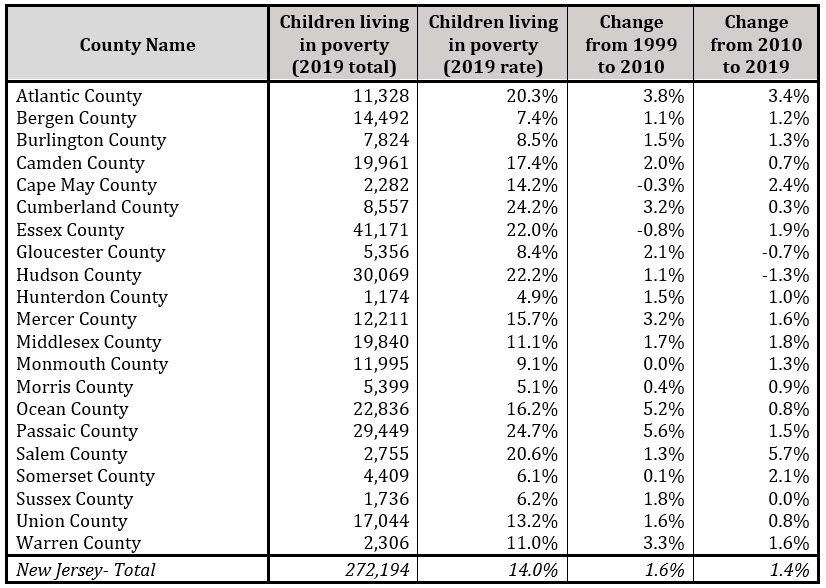
Source: U.S. Census Bureau, 2019;[3]2010;[4]1999.[5] Prepared by R/ECON™.
To supplement the results presented in Table 1, Table 2 displays the distribution of child poverty across family structures in New Jersey. The results indicate that most children living in poverty in 2010 and 2019 resided in mother-only households. Poverty disproportionately affected single-parent households, regardless of the parent’s sex. For instance, in 2019, only 6.6 percent of families living with children in New Jersey were father-only households, yet 10.1 percent of families living with children in poverty were father-only households. Similarly, in 2019, mother-only households represented 20.6 percent of families in New Jersey but made-up 61.3 percent of households with children living in poverty. These figures highlight the burden faced by single-income families. Note that, despite an increase in the state’s child poverty rate from 2010 to 2019 (see Table 1), the share of children from mother-only households living in poverty edged downward from 65.4 percent to 61.3 percent.
Table 2. Poverty Across Family Structures for Families with Children Under 18 Years: NJ Counties, 2010 and 2019
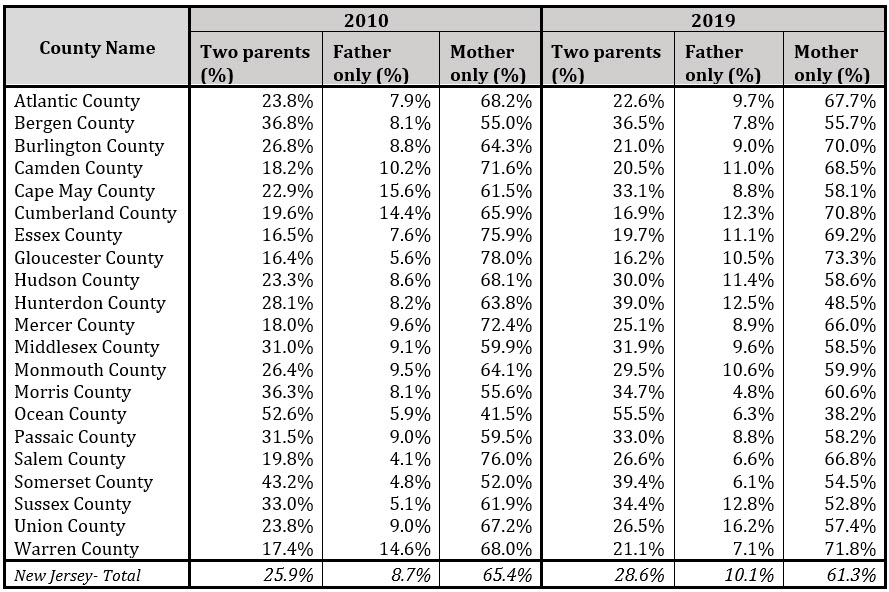
Source: U.S. Census Bureau, 2019;[6] 2010.[7] Prepared by R/ECON™.
Living in poverty tends to stunt the physical and mental development of children. That is, child poverty has adverse effects on the health and educational outcomes as these children become adults. This suggests longer-run health and career implications. Indeed, children growing up in poverty have higher rates of chronic illness, immune disorders, and injury.[8] Several factors contribute to the health disparities faced by low-income youth, including lack of health insurance coverage and underutilization of care (when available),[9] chronic exposure to stressors (i.e., “weathering”),[10] and inadequate diet and nutrition.[11]
In terms of poverty effects on academic performance, research shows that family income regulates multiple aspects of home life that directly influence schooling experiences and cognitive growth, such as safety, health, nutrition, and intellectual stimulation. They also tend to attend “inferior” schools (e.g., poorly equipped schools, less-qualified teachers, limited curriculum offerings).[12] Countless studies that compare academic achievement across different socioeconomic status groups reveal that impoverished students do not perform as well in school as students from wealthier families.[13] In a review of studies on the effect of poverty on education, Anyon (2005, p. 76)[14] stressed that examining how income affects cognitive development does not imply that poor children are less intelligent or less academically capable, rather, “the studies point to the power of the economy — and of economic hardship — to place extremely high hurdles to full development in front of children who are poor.”
In addition to affecting at-home environment, family income influences neighborhood mobility and place of residence, which in turn determines school options and the out-of-home environment in which children spend most of their time. Their neighborhood of residence, for instance, appears to affect children’s long-term outcomes—i.e., earnings and college enrollment.[15] Furthermore, child poverty enables a cadre of tough-to-measure costs that facilitate “psychic” scars of unfulfilled potential, as well as associated pain and grief largely borne by the children themselves as they mature.[16]
The burdens associated with child poverty are not only detrimental to the children themselves and their families, but also for society as whole.[17] In essence, high child poverty rates in New Jersey translate to inflated economic and social costs for all households in the state. Families with lower income tend to live in neighborhoods with higher levels of environmental contaminants such as lead, which has been linked to both impaired cognitive function and higher propensities to commit crimes.[18] It can, for example, also weigh in as environmental costs—such as the blight of poor urban neighborhoods and the costs of “sprawl”[19] generated by those who flee such blight.
Thus, when viewed in purely economic terms, expenditures on effective poverty reduction policies can effectively be viewed as public or social investments. These investments can generate returns to society over time in the form of higher real gross domestic product (GDP).[20] This arises through reduced spending to fight crime and to support publicly provided health care, reduced costs borne by crime victims and those in poor health (e.g., less income and medical expenses), and general improvements in societal quality of life.
References
[1] See, e.g., Bubonya, M., & Cobb-Clark, D. A. (2021). Pathways of disadvantage: Unpacking the intergenerational correlation in welfare. Economics of Education Review, 80, 102066.
Bullinger, L. R., Raissian, K. M., & Schneider, W. (2021). The power of the future: Intergenerational income mobility and child maltreatment in the United States. Child Abuse & Neglect, 105175.
Gadsden, V. L. (2021). Literacy and poverty: Intergenerational issues within African American families. In Fitzgerald, H. E., Lester, B.M., & Zuckerman, B. (eds) Children of poverty, Routledge, pp. 85-124.
Hartley, R. P., Lamarche, C., & Ziliak, J. P. (2022). Welfare reform and the intergenerational transmission of dependence. Journal of Political Economy, 130, 523-565.
[2]U.S. Census Bureau (2019). B17001 Poverty Status in the Past 12 Months by Sex by Age. 2015-2019 American Community Survey 5-Year Estimates.
[3] Ibid.
[4] U.S. Census Bureau (2010). B17001 Poverty Status in the Past 12 Months by Sex by Age. 2006-2010 American Community Survey 5-Year Estimates.
[5] U.S. Census Bureau (2000). P087 Poverty Status in 1999 by Age. 2000 Decennial Census of Population and Housing.
[6] U.S. Census Bureau (2019). B17012 Poverty Status in the Past 12 Months of Families by Household Type by Number of Related Children Under 18 Years. 2015-2019 American Community Survey 5-Year Estimates.
[7] U.S. Census Bureau (2010). B17012 Poverty Status in the Past 12 Months of Families by Household Type by Number of Related Children Under 18 Years. 2006-2010 American Community Survey 5-Year Estimates.
[8] Gitterman, B.A., Flanagan, P.J., Cotton, W.H., Dilley, K.J., Duffee, J.H., Green, A.E., Keane, V.A., Krugman, S.D., Linton, J.M., McKelvey, C.D., & Nelson, J.L. (2016). Poverty and child health in the United States. Pediatrics, 137(4).
[9] Griffith, K., Evans, L., & Bor, J. (2017). The Affordable Care Act reduced socioeconomic disparities in health care access. Health Affairs, 36(8), 1503-1510.
[10] Research on racial and ethnic health disparities find that the chronic stress endured by U.S. minorities due to multigenerational poverty, environmental adversity, and familial challenges, amongst others, generate “premature biological aging and health disadvantages”— this phenomenon has been termed “weathering” (Schmeer & Tarrence, 2018, p. 411).
Schmeer, K. K., & Tarrence, J. (2018). Racial-ethnic disparities in inflammation: evidence of weathering in childhood? Journal of Health and Social Behavior, 59(3), 411-428).
[11] AAP Council on Community Pediatrics (2016). Poverty and child health in the United States. Pediatrics, 137(4).
[12] Biddle, B. (2013). Social class, poverty, and education: Policy and practice. New York: Routledge.
[13] Berliner, D. C. (2007). Our impoverished view of educational reform. In Sandovnik, A. R. (Ed.), Sociology of education: A critical reader (pp. 487-516). New York, NY: Routledge.
[14] Anyon, J. (2005). What “counts” as educational policy? Notes toward a new paradigm. Harvard Educational Review, 75(1), 65-88.
[15] Chetty, R., & Hendren, N. (2018). The impacts of neighborhoods on intergenerational mobility I: Childhood exposure effects. The Quarterly Journal of Economics, 133(3), 1107-1162
[16] Holzer, H. J., Whitmore Schanzenbach, D., Duncan, G. J., & Ludwig, J. (2008). The economic costs of childhood poverty in the United States. Journal of Children and Poverty, 14(1), 41-61.
[17] Belfield, C. R., & Levin, H. M. (Eds.). (2007). The price we pay: Economic and social consequences of inadequate education. Brookings Institution Press
[18] Nevin, R. (2000). How lead exposure relates to temporal changes in IQ, violent crime, and unwed pregnancy. Environmental Research, 83(1), 1-22.
[19] Ewing, R., & Hamidi, S. (2017). Costs of sprawl. Routledge.
[20] See endnote 15.


