by Tia Azzi and Michael Lahr, Rutgers Economic Advisory Service (R/Econ™) for New Jersey State Policy Lab
According to the latest Census count, New Jersey’s population peaked above nine million for the first time in 2020. More precisely, it had 9,288,994 inhabitants in 2020, an adjustment of 400,968 from prior Census Bureau estimates for 2020. That is, Census estimates were off by a whopping 4.3 percent! This piece provides state, county, and municipal policymakers with some insight into where and by how much decennial Census figures were adjusted from 2020 estimates. As they come out, we will inform similarly in revisions to annual intercensal population counts by county and municipality for New Jersey as well as on any adjustments to counts of households.
County Regions
In other work for the New Jersey State Policy Lab, we have broken New Jersey counties into broader regions: the Highlands, the Shore, North Jersey, Central Jersey, and South Jersey. The Highlands counties consist of Sussex, Warren, and Hunterdon. The Shore consists of Atlantic, Ocean, and Cape May counties. North Jersey consists of Bergen, Essex, Hudson, Morris, Passaic, and Union counties. Central Jersey consists of Mercer, Middlesex, Monmouth, and Somerset counties. And South Jersey consists of Salem, Cumberland, Gloucester, Camden, and Burlington counties. For this paper, we continue to use these categories when describing New Jersey’s communities. In maps, these New Jersey regions are outlined in green throughout.
Population Difference: Estimates vs. Actuals
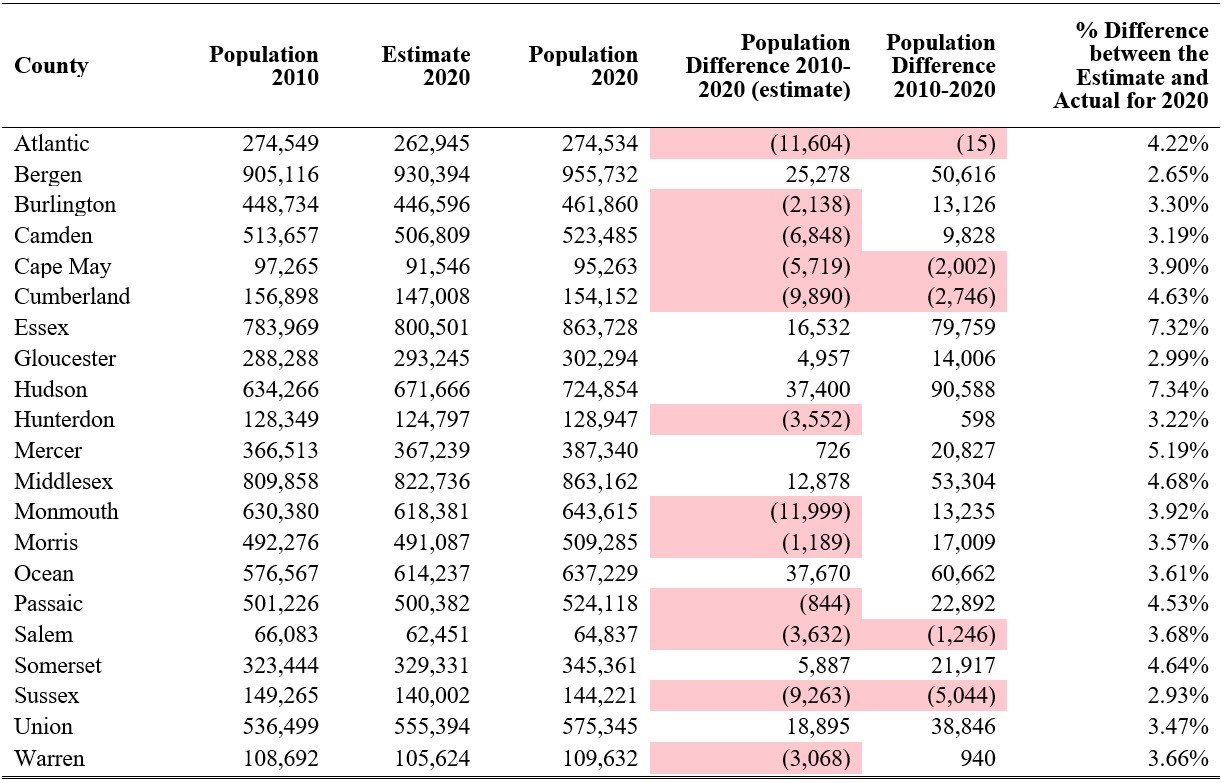
The United States Bureau of the Census underestimated the New Jersey population for the 2020 year. So, we thought it would be worthwhile to see where the estimated intercensal changes go most awry. There are two ways to do this, by percentage difference between 2010-2020 population changes identified by estimates and the decennial census counts (divided by the changes noted by the decennial census) and by the simple difference between the two intercensal values. We look at each in turn.
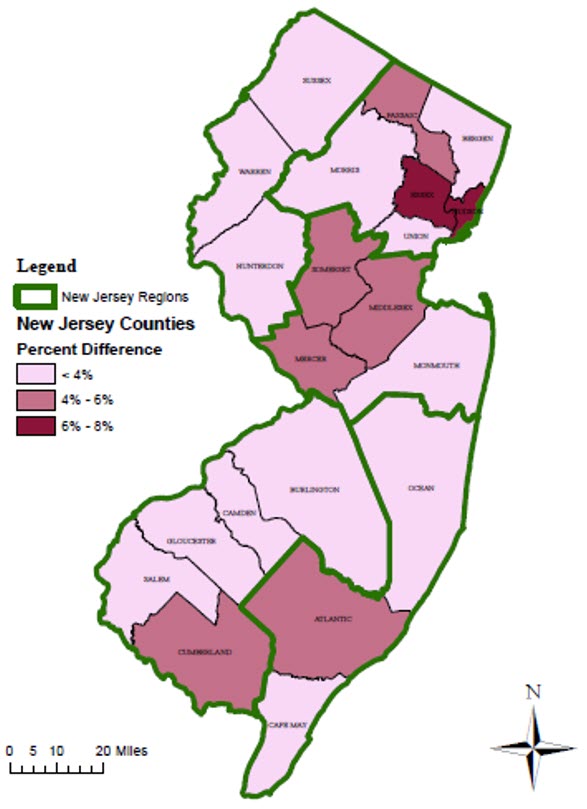
Percentage difference. The statewide percent adjustment was +4.31 percent of the 2020 decennial population figure; this is near the midpoint of the range in the county percentage differences— +2.65 percent to +7.34 percent. No negative percentage difference in the intercensal change in population was identified for any county (see Appendix Table A1 and Figure 1). Among New Jersey’s 21 counties, Essex (+7.32%) and Hudson (+7.34%) counties show the greatest percentage of upward adjustments from the decennial census counts. Note that both are located in North Jersey. The lowest percentage adjustment (+2.65%) was experienced by Bergen County, which is also located in North Jersey. Still, Figure 1 shows that other counties with the greatest percent differences tend to be in North and Central Jersey. Indeed, three out of the four counties in Central Jersey display higher-than-average percentage differences from the decennial census figures. Notably, no county in the Highlands improved their counts more than the statewide average revision.
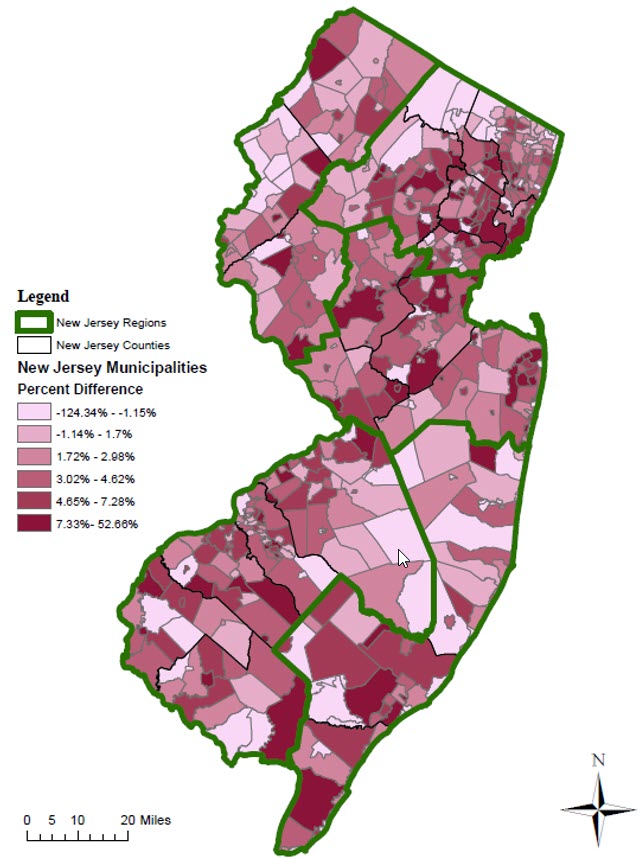
An examination of estimates and actual 2020 census figures across the state’s municipalities reveal a wider range of adjustments in the intercensal population change values (see Appendix Table A2). Here they range from a minimum of -124.3 percent[1] and a maximum of 52.7 percent. A negative percentage difference means a downward adjustment from the municipality’s 2020 estimate. In fact, a total of 136 of New Jersey’s 565 municipalities[2] experienced downward adjustments to their 2020 population figures from the Census Bureau. Interestingly, West Wildwood is the only municipality that incurred no adjustment whatsoever. The remaining 428 municipalities (more than 75%!) had their population numbers adjusted upward. Many municipalities had upward population adjustments in double-digit percentages.
Figure 1: Percent Difference between the 2020 Estimate and Decennial Census Count by County
Municipalities with the largest percentage adjustment include Greenbrook Township (52.7%), Pine Valley Borough (47.6%), Tavistock Borough (44.4%), Mantoloking Borough (24.2%), and Loch Arbour Village (20.5%). Note, these municipalities tend to have small populations, and none is located in North Jersey, even though its counties are among the greatest beneficiaries of the decennial census updates when compared to the estimates. New Jersey municipalities with the largest downward population adjustment percentage-wise include Medford Lakes Borough (-124.3%), Green Township (-93.1%), Walpack Township (-57.1%), Rockleigh Borough (-28.5%), and New Hanover Township (-26.4%). These municipalities are dispersed across regions, located in Burlington (South Jersey), Sussex (Highlands), and Bergen (North Jersey) counties. Indeed, the municipality map in Figure 2 shows just how widespread the most extreme percentage-wise adjustments are.
Figure 2: Percent Difference between the 2020 Estimate and Decennial Census Count by Municipality
Differences in Population Count. Like percentage difference, the largest difference in population counts by county also mostly were experienced in North and Central Jersey. Figure 3 suggests that within these two regions only Somerset County was “below average.” Still, its population rose by 16,030 inhabitants. The Highlands experienced the smallest population adjustment to its 2020 decennial population count via 2020 estimates. All population counts by county in the Highlands region were off by no more than 4,000.
Figure 3: Difference of the Estimate from the Final 2020 Population Count by County/Municipality
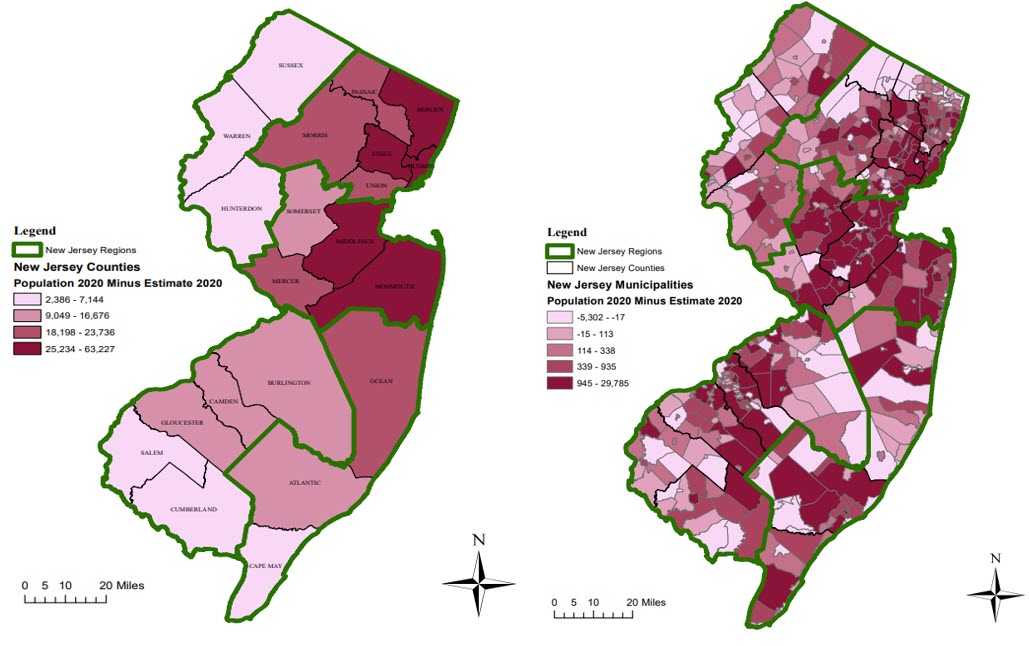
The population estimates for the State of New Jersey underestimated those reported in the decennial census by 400,968 individuals. Since there were 565 municipalities at the time of the Census, a New Jersey municipality gained on average around 710 inhabitants. At the municipal level, the greatest population differences of estimates from those in the decennial census generally remain situated in the North and Central Jersey. Several municipalities had population counts that were severely adjusted downward: Medford Lakes Borough (-5,302), Green Township (-3,379), Brick Township (-1,452), Camden City (-1,949), and New Hanover Township (-1,679). But, as might be expected from the state’s overall population gains from the update, most municipalities improved their lots. Those gaining the most population via the update were Jersey City (29,785), Newark City (29,029), Lakewood Township (27,719), Paterson City (14,931), and Elizabeth City (8,916). Meanwhile, most of the rest were in the North and Central Jersey (see Figure 3).
Appendix
Table A1: New Jersey County Population Change, 2010-2020