
By Will Irving
The United States Bureau of Economic Analysis (BEA) recently began publishing state-level data on the distribution of personal income across households. Similar income distribution and income inequality data has previously been available from other sources such as the IRS and U.S. Census Bureau. However, the BEA’s new approach draws on a wide variety of measures from those and various other sources to estimate the distribution of the BEA’s broader measure of personal income, which includes in-kind government transfers and other components not included in other measures of personal income.[1] These newly released data offer an opportunity to examine the distribution of income and income inequality in New Jersey compared to the nation and other states over the last decade, with the possibility of eventually incorporating these measures into the R/ECON state economic forecast.
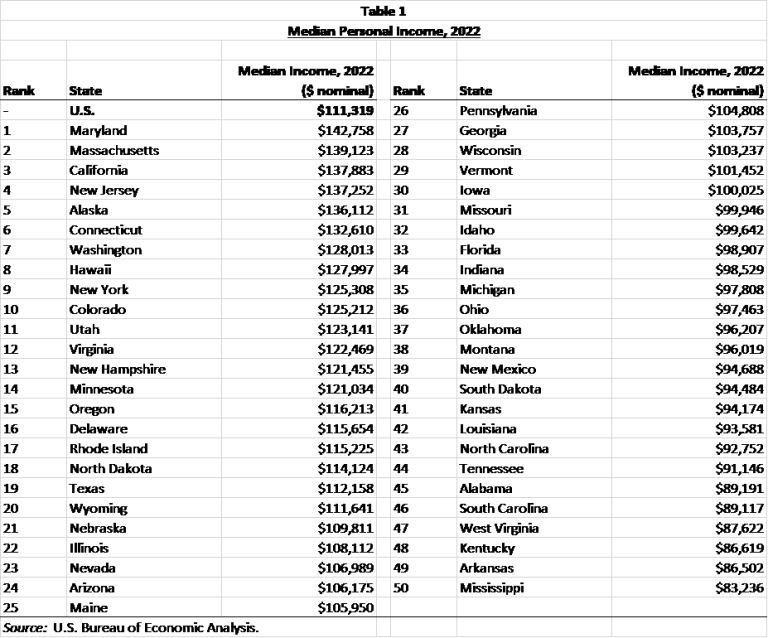
Based on the BEA data for 2022, New Jersey’s median personal income ranked 4th in the nation at $137,252, about 23% higher than the national median (see Table 1). New Jersey’s median was up 32.6% from 2012, ranking 37th among the states, compared to a national increase of 45.7% over the decade. The state’s total personal income grew by $230.4 billion, or 47.5%, over the ten-year span, ranking 31st in the nation, compared to national nominal income growth of 56.9%.
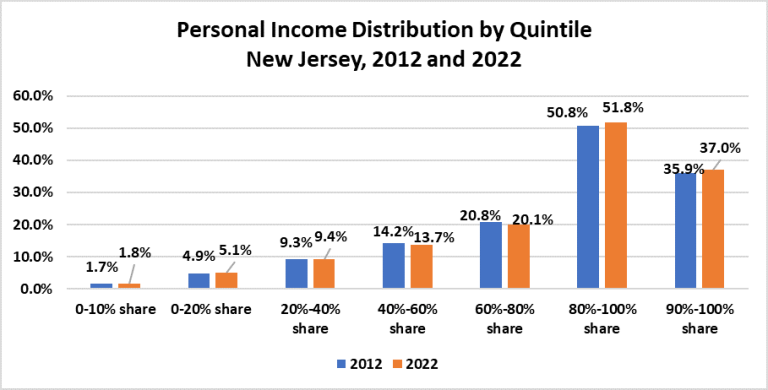
The chart below shows the distribution of personal income by income quintile, as well as for the top and bottom deciles, in New Jersey in 2012 and 2022.[2] While the share of total personal income received by the bottom decile of the income distribution increased by just 0.1 percentage point over the decade, the share received by the top decile increased by 1.1 percentage points. Nearly 40% of the increase in income went to the top 10% of the income distribution, with nearly 54% going to the top 20%. In contrast, the bottom ten percent of households received only about 2% of the total income gain over the decade. This distribution is similar to that of the U.S. The top decile nationally saw its share of total personal income go from 36.5% to 37.1%, accounting for about 38% of the increase in total personal income over the decade. Notably, the share of New Jersey’s total personal income going to the middle and upper-middle quintiles of the distribution has decreased by 1.2 percentage points, reflecting a longer-term national decline in the middle class share of income found in studies based on other income measures.
Among the measures of income distribution/inequality calculated by the BEA is the Gini coefficient for each state (based on equivalized income). The Gini coefficient is a metric of dispersion that measures the degree of inequality, usually of wealth or income. It ranges from 0 (complete equality) to 1 (maximum inequality), where all income is concentrated at the top. Gini coefficients for personal income in 2022 ranged from 0.37 (Maine) to 0.52 (South Dakota). New Jersey matched the national coefficient of 0.44, having been as high as 0.47 in 2018 before dropping to 0.42 in 2020, driven lower in part by elevated transfer payments that bolstered incomes among lower earners.
This new data from the BEA includes additional measures, including the quintile distribution of components of personal income such as rental income, personal transfer receipts, and proprietor’s income, as well as additional measures of income inequality. Future posts will explore these metrics in more detail.
References:
[1] See https://www.bea.gov/sites/default/files/2023-10/StateIncome%20Distribution_TechnicalDocument.pdf for more information on BEA’s personal income measure and the methodology for estimating state income distributions.
[2] Income deciles and quintiles are based on rankings of households by equivalized income, a measure that adjusts for household size and composition. Shares of total personal income represent the sum of (unequivalized) income of all households in each quintile as a percentage of total income.