
by Naheed Azhar and Michael L. Lahr, R/Econ for New Jersey State Policy Lab
As the count of listings and asking prices flattened,[i] realtors and creditors predicted a rise in foreclosures and mortgage delinquencies as people were laid off and furloughed and as many small businesses failed.[ii] But things did not roll out as feared for housing markets. Overall, housing markets remained vibrant nationwide. Low-interest rates improved housing affordability and a low inventory led to steep increases in home prices. Thus, home real estate markets intensified in 2021 due to what appears to have been a buyer frenzy that drove single-family home prices steeply upward across the State of New Jersey. More single-family homes closed despite fewer listings in New Jersey. Looking by county, increases in the median sales price of single-family homes ranged between 9.1% (Essex County) to 25.3% (Salem County).
Figure 1. Single-Family Home Listings, Closings, and Median Sales Price 2021
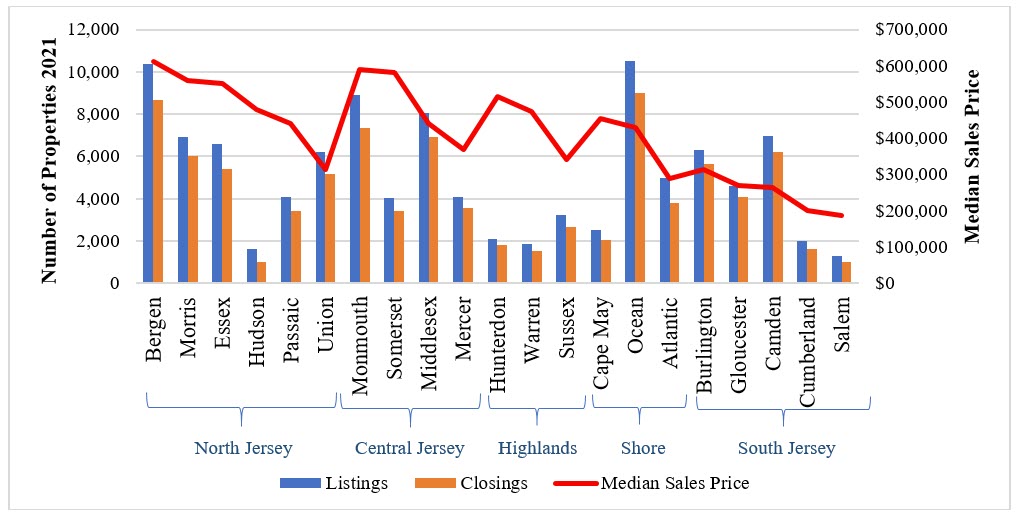
Figure 1 shows county-level single-family housing data for 2021 in New Jersey. The counties within each region are ordered from highest to lowest average sales price in 2021; the regions are ordered based on the county with the highest average 2021 sales price within each region. That is, from left to right in Figure 1, the regions are North Jersey (Bergen County with the highest price and Union County with the lowest), Central Jersey (Monmouth through Mercer), the Highlands (Hunterdon through Sussex), the Shore (Cape May through Atlantic), and South Jersey (Burlington through Salem). The same ordering is applied to Figures 2 and 3. (The data for all of the figures are available in Appendix 1.)
Not surprisingly, as they had more households, together North and Central Jersey experienced more market activity in 2021 than did South Jersey, the Shore, and the Highlands combined. Note that counties with lower median home prices tended to secure a greater percentage rise in that price. The home values in Union and Mercer Counties reflect 11.1% and 15.6% increase respectively from the median prices in 2020. Median single-family home prices increased by 9.7% in Bergen County and 14.0% in Monmouth County. One can interpret a lower percentage increase to mean less buying pressure. Thus, it would seem markets in the southern parts of the state were relatively speaking more active than those in its northern reaches.
Compared to 2020 the housing market in the State of New Jersey performed much better in 2021. This is certainly true for sale prices, which continued to soar statewide. Note in Figure 2 that no New Jersey county had less than a 9% rise in the average sales price of single-family homes in 2021 (the red line). The number of days from listing to closing fell, and the percent of list price received rose. Few counties tendered more listings from 2020 to 2021 (only Hudson, Mercer, Gloucester, Cumberland, and Salem counties did), and most enjoyed larger shares of listings that closed (just Cape May, Gloucester, Cumberland, and Salem counties did not).
In short, low inventories affected median home prices. The decline in listings also affected the number of days a property remained on the market. The tendency to bid higher than the asking price also contributed to closure of properties at higher-than-listed prices. The effect of the declining number of listings on prices, however, was not the same across the state. As Figure 2 shows, some counties (Cape May, Cumberland, and Salem) experienced steep price hikes while others’ experiences were more moderated. In Salem and Cumberland counties, however, median home prices rose steeply despite an increase in listings. Of course, they also are among the most sparsely populated counties in the state.
Figure 2. Single-Family Homes 2020-2021:
% Change in Properties Listed and Closed, and % Change in Median Sales Price
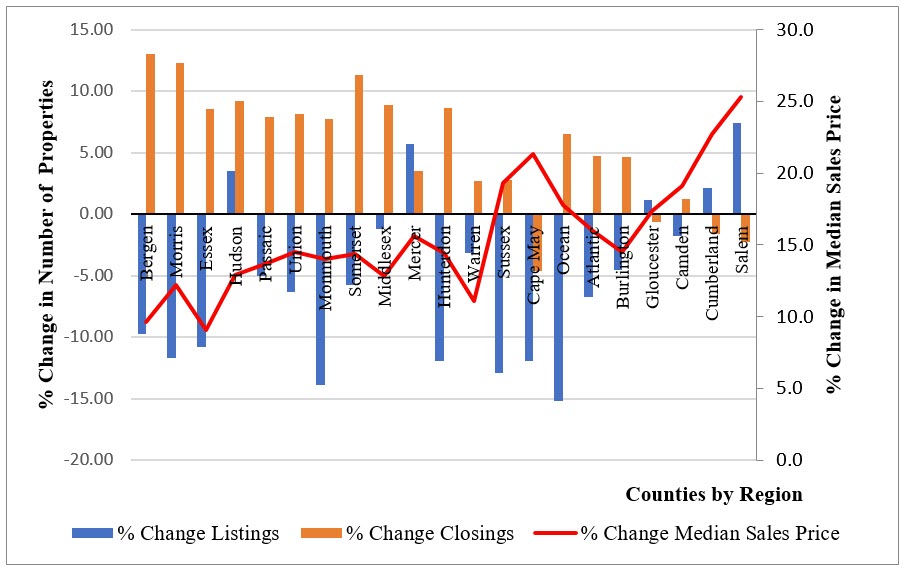
In terms of volume of market activity, Cape May and Salem counties had fewer listings in 2021 compared to 2020. Moreover, Cape May County closed 4.6% fewer properties in 2021 than in 2020. Mercer County was an outlier in that it trended upward on all counts—listings, properties closed, and median sales prices. In all counties, however, the median sales price of single-family homes rose, with Salem rising highest percentage at 25.3% of its median sale 2020 price, followed by Cumberland and Cape May at 22.7% and 21.3%, respectively. The higher percent increase in price is inversely associated with number of days a property remained on the market. That is, counties with greater percentage rises in the median sales price also tended to have single-family homes on the market for fewer days. Table 1 shows how price change and change in the number of days a property was listed appear to be quite related among the top-performing counties.
Table 1: Change in Days Listed for Top Price-Performing NJ Counties, 2020-2021
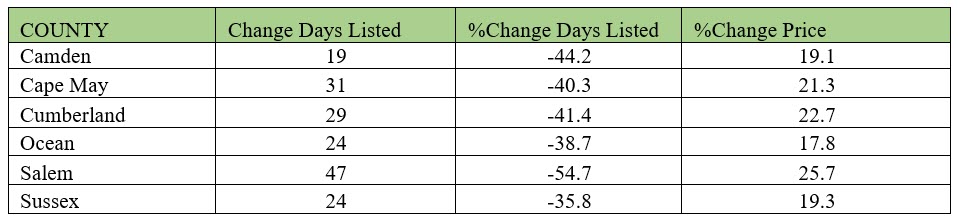
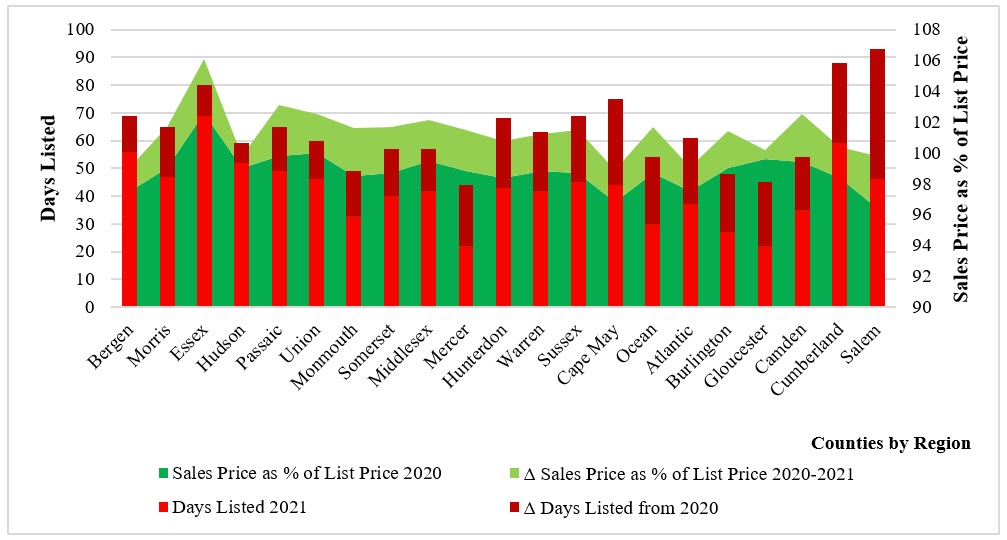
Figure 3 below shows by county that days listed for single-family homes were consistently higher in 2020 than in in 2021 (the darker red on the bars is the difference). It also shows that the median sale price of single-family homes as a percent of the price listed was higher for all counties in 2020 than in 2021 (the light green shading is the difference). The sales-to-list price percentage rose in all counties, with percentage point changes ranging from 0.6% to 3.5%. This ratio “improved” in Essex, Passaic, Ocean, Camden, and Salem counties by more than three percentage points. Only in Gloucester and Hudson did it improve by less than a percentage point.Source: R/Econ™ calculations using data from New Jersey Realtors. (2022) “FastStats” available online in March 2022 from http://njar-public.stats.10kresearch.com/reports
Figure 3. Days Listed and Sales Price as a Percent of List Price for Single-Family Homes by New Jersey County, 2020-2021
The pursuit of rapid closures in 2021 suggests that buyers sought to avoid bidding wars. That is, as soon as a single-family home went on the market one or more buyers would “jump on it and overbid.”[iii] Given the current strong economy and low interest rates, prices are expected to continue to be buoyant. So, this behavior is not expected to change until late summer 2022 at the earliest. This should enable a price rise of about 5% in 2022.[iv] The main risk to housing markets is the continued threat of inflation, and, even then, market activity depends on the degree to which New Jersey household incomes can keep pace with inflation.