
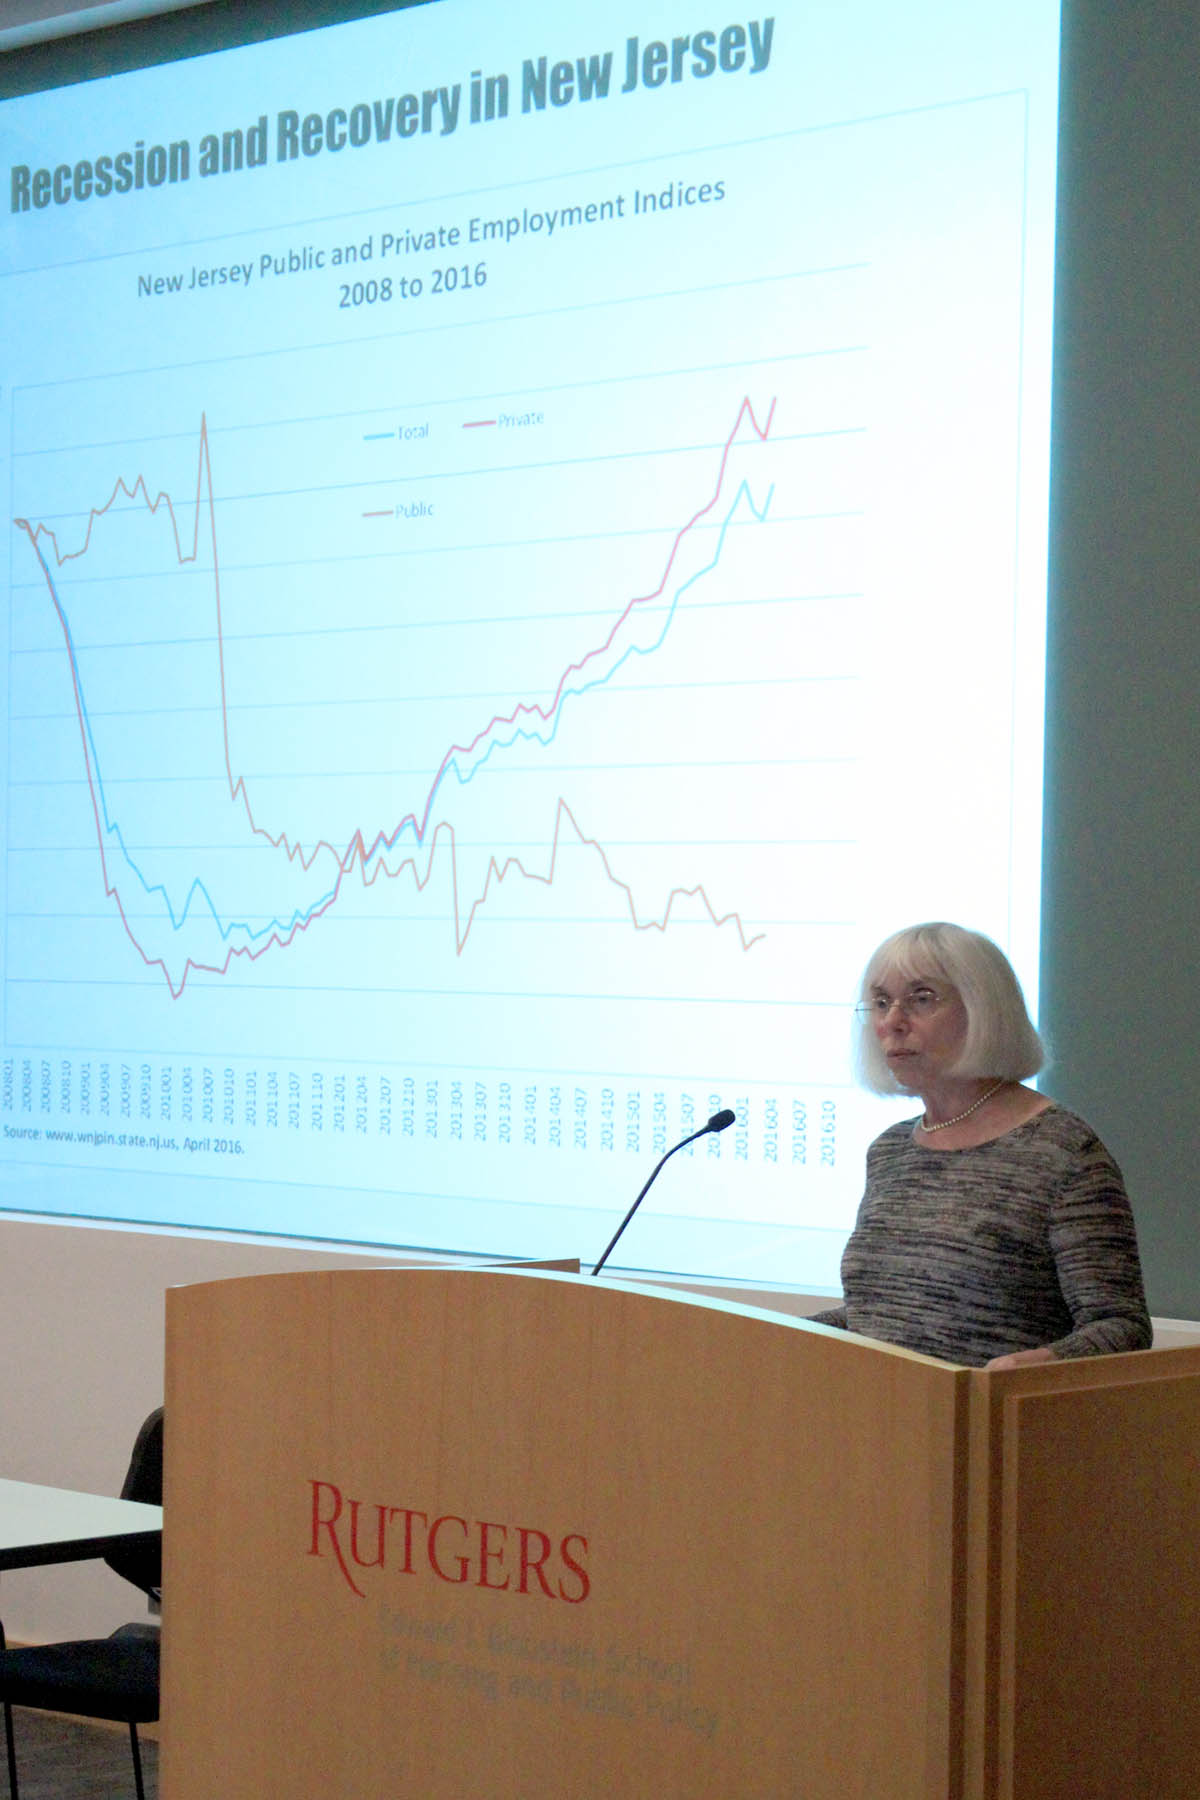
 New Jersey added 55,700 jobs last year – the vast majority in the private sector – and now has recovered 91 percent of the more than a quarter-million jobs lost during the Great Recession of January 2008 to September 2010.
“This was the state’s best performance since 2000,” said Nancy Mantell, director of the Rutgers Economic Advisory Service (R/ECON). “We should recover the balance by early 2017, and by the end of the forecast period in 2026, the employment base should be 370,000 jobs, or 9 percent greater than at its 2008 peak of 4.09 million jobs.”
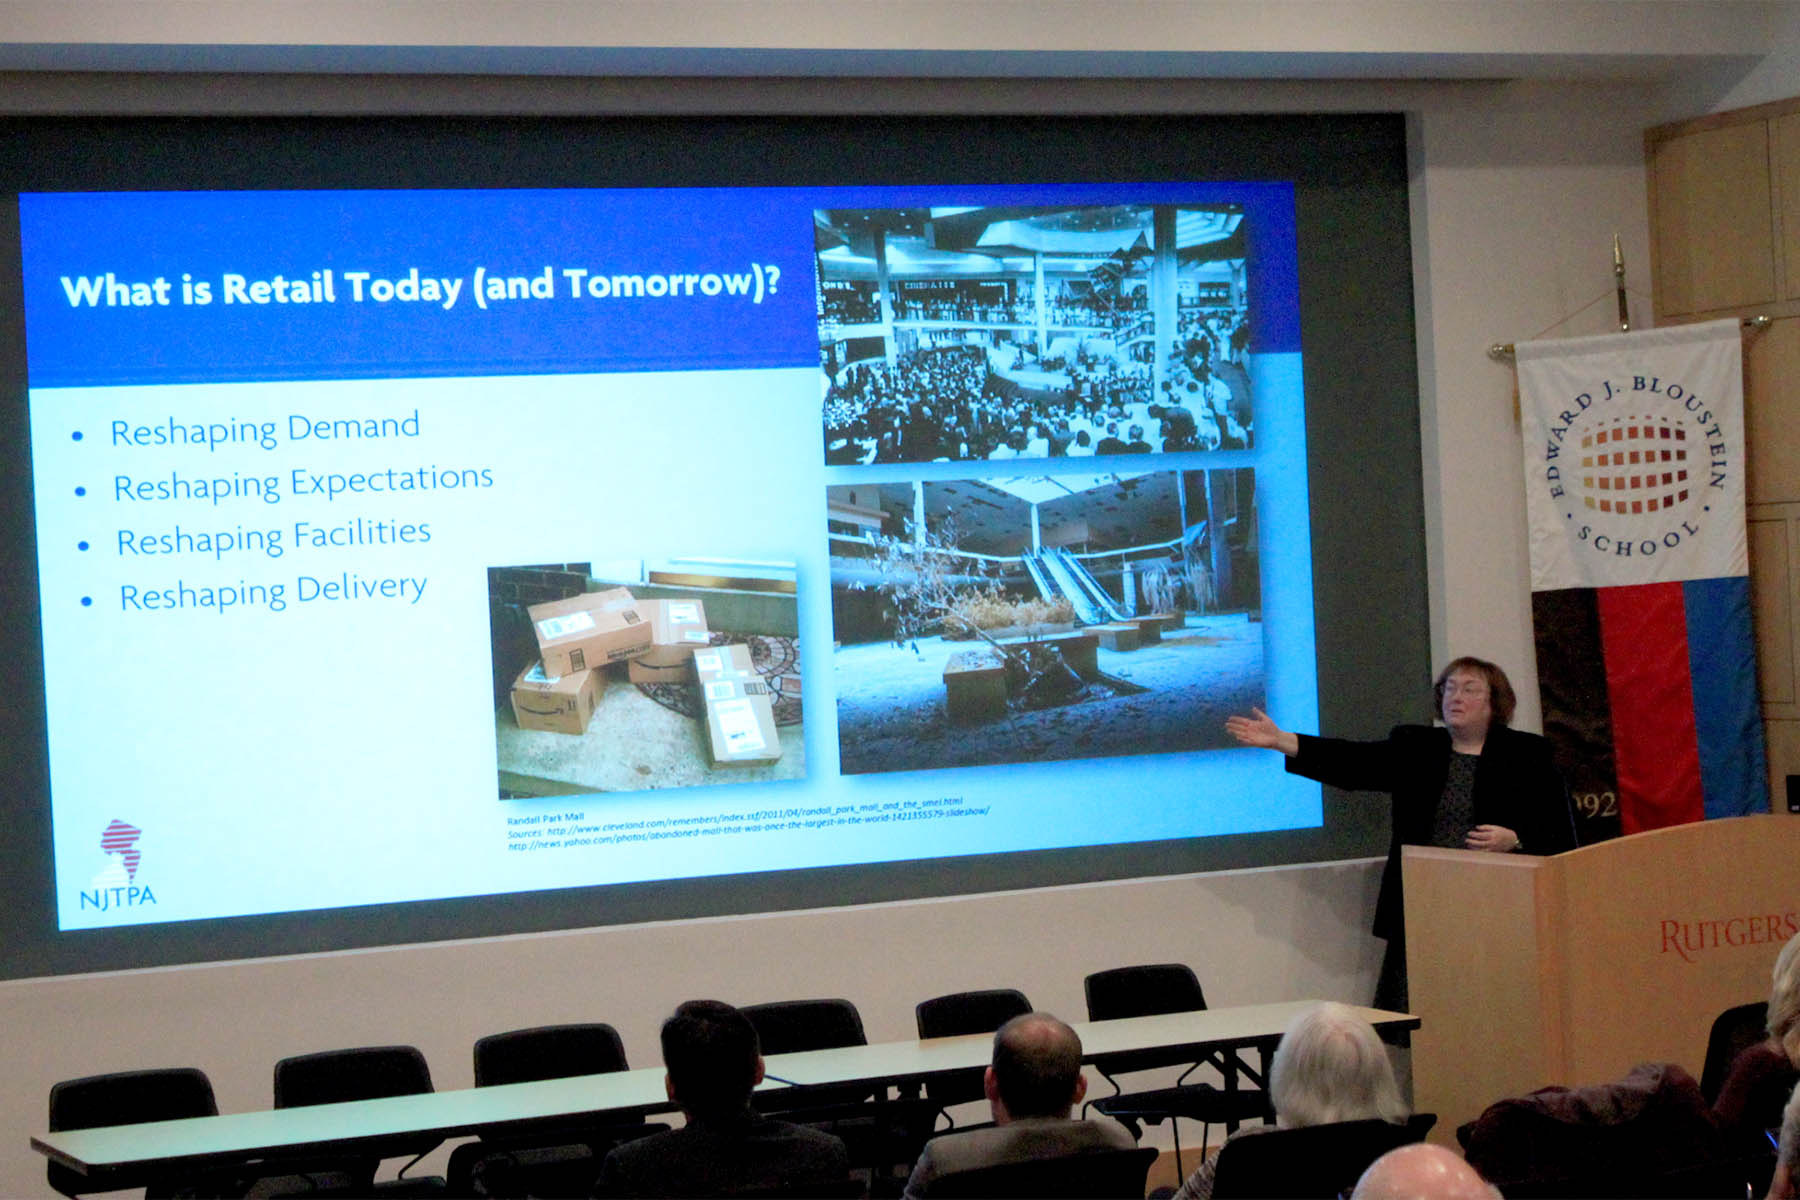
Mantell made her prediction at today’s R/ECON semiannual subscriber conference at Rutgers’ Edward J. Bloustein School of Planning and Public Policy. She was joined by Professor and Bloustein School Dean James W. Hughes, who reviewed recent historic trends and the new realities of the state and national economies, and Anne Strauss-Wieder, director of freight planning, North Jersey Transportation Planning Authority, who discussed the changes, challenges and potential opportunities for freight carriers, businesses and government agencies in addressing and accommodating the new forms of retail shopping and delivery to consumers in “The Changing Last Mile: The Consumer, the Click and the Delivery.”
 While New Jersey’s nonagricultural employment rose by 1.4 percent in 2015, after growth of 0.8 percent, or 32,900 jobs in 2014, the state’s recovery rate still lags the nation’s. As of March 2016, the national employment base was 3.9 percent above its January 2008 peak. It will exceed that previous high point by 14.4 percent at the end of the R/ECON forecast in 2026. “Our recovery has been longer and slower than the country’s, but from 2018 on, the rate of employment growth of the state and nation will be similar,” Mantell said.
The Rutgers economist explained that another encouraging sign was that the output lost in the recession in New Jersey from early 2008 to late 2009 was finally regained by early 2015. Still, the news was mixed. “The nation’s lost output was made up by mid-2011,” she said. “The state’s output recovery took about three-and-a-half years longer.”
R/ECON estimates Real Gross State Product growth of 2.2 percent in 2016, with an annual average of 1.9 percent to the end of the forecast in 2026.
The state’s falling unemployment rate has been another indicator of recovery, Mantell said. It fell from 6.4 percent in January 2015 to 4.8 percent in December. It averaged 4.4 percent in the first quarter of 2016, a level not seen since the end of 2007. The rate averaged 5.6 percent in 2015 and is expected to average 4.7 percent this year. From 2017 through the forecast’s conclusion, the annual average rate is predicted at 5.1 percent, remaining higher than the national norm except for a brief reversal this year.
New Jersey consumers’ buying power should be helped by a pair of factors: modest personal income growth coupled with low inflation. For the second straight year, state personal income will rise by 4.3 percent, spurred by improving labor market conditions. Over the next decade, Mantell estimates annual income growth to average 4.1 percent.
Low inflation will continue to allow New Jerseyans’ dollars to go further. The state’s consumer prices rose 1.3 percent in 2014, just less than the national rate. It dipped almost imperceptibly in 2015, held back by falling oil and other energy prices both early and late in the year. Prices will rise 0.6 percent in 2016 and at an average of about 2.6 percent during the rest of the forecast period, similarly to the U.S. consumer inflation rate.
R/ECON, part of the Center for Urban Policy Research at Rutgers’ Edward J. Bloustein School of Planning and Public Policy, provides private-sector and government entities with a comprehensive set of tools for analyzing the New Jersey economy.
SUMMARY OF NEW JERSEY ECONOMIC FORECAST
2014 2015 2016 2016-26
Annual Percentage Change
Nonagricultural
Employment 0.8% 1.4% 1.4% 0.8%
Real Gross State Product 0.4% 1.9% 2.2% 1.9%
Personal Income 4.5% 4.0% 4.4% 4.1%
Population 0.4% 0.2% 0.3% 0.6%
Consumer Prices 1.3% 0.0% 0.6% 2.6%
Percentage
Unemployment rate 6.7% 5.6% 4.7% 5.1%
(average)
Source: R/ECON


