New Jersey Policy Lab: New Jersey Intercounty Migration Trends, 2018-2019

February 4, 2022

by Tia Azzi and Michael Lahr, R/Econ for New Jersey Policy Lab

The latest report from R/ECON examines the migration trends across counties within New Jersey between 2018 and 2019. This report uses Internal Revenue Service (IRS) data, rather than that from the U.S. Census, to report migration by county.

This analysis divides New Jersey into five regions to assess the trends of intercounty migration. In- and out-migration of counties within the regions tends to be driven largely by intercounty movements within the regions. First, the Highlands counties of Sussex, Warren, and Hunterdon experienced positive net migration rates, largely from neighboring northern NJ counties – Morris, Somerset, and Passaic counties. Second, the three shore counties of Atlantic, Ocean, and Cape May also experienced positive net migration rates. Ocean was a recipient of significant inflows from Monmouth County. The continued upswing in the state’s economy and the rising propensity to telecommute undoubtedly supported the positive rates for these first two regions. Third, in South Jersey, Camden and Cumberland counties experienced negative net in-state in-migration. Camden is the region’s urban core, and its negative rate aligns with the experience of core urban counties of North Jersey–Essex, Hudson, and Union. Fourth, Central Jersey presented a mixed set of in-migration rates from 2018 to 2019, albeit all centered near-zero net migration. Finally, in North Jersey, the region largest in terms of population of the five New Jersey regions (about 44% of the state’s population), only Morris County experienced a positive net in-state in-migration rate. Of the six counties of North Jersey, only Morris lacks a substantial urban core and is also furthest from Manhattan.

This report concludes that while there is some discussion by politicians, developers, real estate professionals, and transit advocates[i] about New Jerseyans’ preferences to move to transportation hubs, IRS data suggest that suburbanization within the state continued to be a mainstay of development. Additionally, intercounty migration tends to occur most frequently between neighboring counties, as households generally opt not to move too far from their original homes.

For further analysis on intrastate migration rates within specific counties, read R/Econ’s full report.

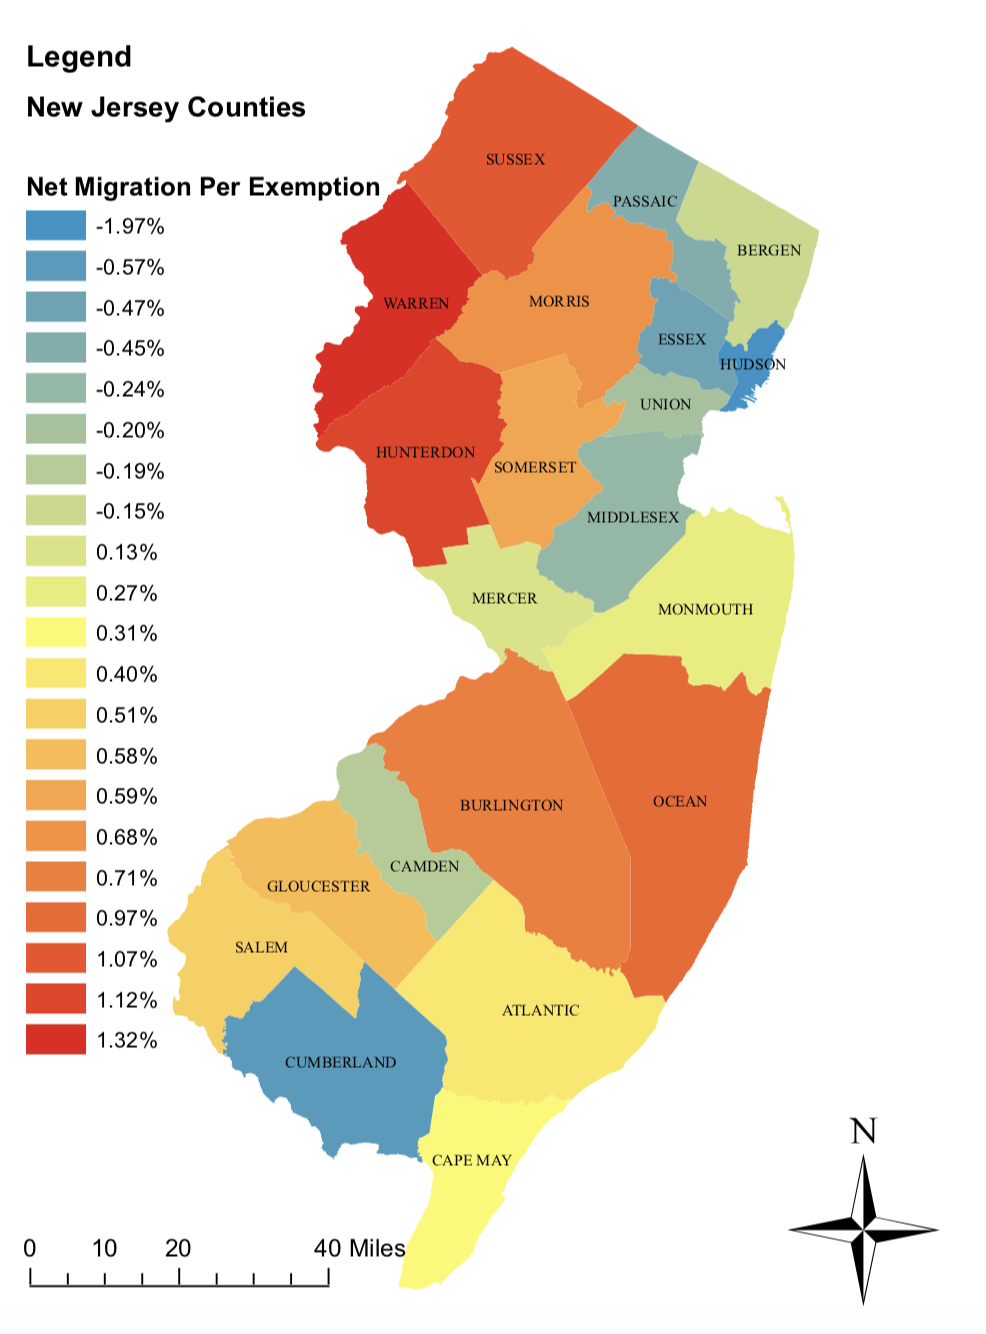
Figure 1: County Net Migration Rates in New Jersey, 2018-2019

County Net Migration Rates in New Jersey, 2018-2019
Source: U.S. Internal Revenue Service. (2021). “SOI Tax Stats-Migration Data” with R/ECON calculations

[i] Evans Tim. (2019). “Job Growth Finally Following Population to Compact Centers,” New Jersey Future Blog, May 3. Available online in February 2022 from https://www.njfuture.org/2019/05/03/job-growth-compact-centers/

Evans, Tim. (2019). “Population Growth in Older Centers (but not all of them) Continues to Outstrip the Rest of the State,” New Jersey Future Blog, June 3. Available online in February 2022 from https://www.njfuture.org/2019/06/03/population-growth-higher-in-older-centers/

Fitzgerald, Thomas. (2021). “N.J. Gov. Phil Murphy Launches Project to Overhaul South Jersey’s Public Transit Hub,” The Philadelphia Inquirer, February 17. Available online in February 2022 from https://www.inquirer.com/transportation/camden-walter-rand-redevelopment-south-jersey-transporation-hub-20210217.html

p of people of all ages, races, and backgrounds who identify as lesbian, gay, bisexual, transgender, and queer. Often, the LGBTQ acronym is written with a plus at the end to represent other identities including, but not limited to, nonbinary, genderqueer, and gender non-conforming.

Recent Posts

Mian: Affordable housing in God’s backyard

Affordable housing in God’s backyard: Some religious congregations find a new use for their space By Nadia Mian, Ph.D., Senior Program Director, Ralph W. Voorhees Center for Civic Engagement Faced with declining membership, aging buildings and large, underutilized...

Do you have one of the most common jobs in New Jersey?

Nearly 4.6 million people work in New Jersey in thousands of different types of jobs. But nearly 840,000 positions make up the top 10 most common roles, according to data from the U.S Bureau of Labor Statistics. Laborers and freight stock and material movers — those...

NJSPL – The New Jersey Induced Travel Calculator

By Robert B. Noland Induced travel occurs when new roads or lanes are built with the goal of reducing traffic congestion. What this means in practice is that new travel fills the new roads or lanes such that the goal of congestion reduction is not met. While many...

Kelly O’Brien (MCRP ’09) Named Fairfax City Hometown Hero

On July 15th, Kelly O'Brien (MCRP '09)  was recognized as a Hometown Hero during Fox 5 DC's Zip Trip visit to Fairfax City. "Although I don't think of myself as a hero, I am grateful for the chance to express my dedication to serving my community and shed light on the...

Winecoff: Working Paper on Health Insurance Enrollment

Spillovers in Public Benefit Enrollment: How does Expanding Public Health Insurance for Working-Age Adults affect Future Health Insurance Choices? Abstract Enrollment in one public benefit program often affects enrollment in others. We study life-course spillovers by...

Upcoming Events

Event Series CAREERS

Virtual Career Drop-ins

Virtual

Stop by virtually on Mondays (except for holidays) beginning September 9th through December 16th between 11 am and 1 pm to ask a quick (15 min) career-related question of Bloustein […]