
In “zipcodeR: Advancing the analysis of spatial data at the ZIP code level in R,” (Software Impacts) Gavin Rozzi, Research Computing Specialist with the Rutgers Urban & Civic Informatics Lab at the Bloustein School, looks at the development of the zipcodeR R package and its implications for data analysis by academics and social scientists.
ZIP codes are one of the most common forms of geographic data encountered by researchers in the social sciences. Among other things, data aggregated at the ZIP code level are used to predict social determinants of health and reveal inequalities in small areas. However, the use of ZIP codes is not as valuable when studying changes over time compared to Census tracts. zipcodeR is a package for the R (available on the Comprehensive R Archive Network or CRAN) that seeks to make research using ZIP codes easier and more accessible for researchers conducting geospatial analysis.
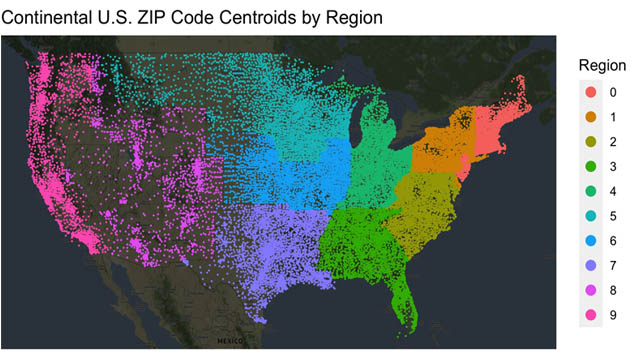
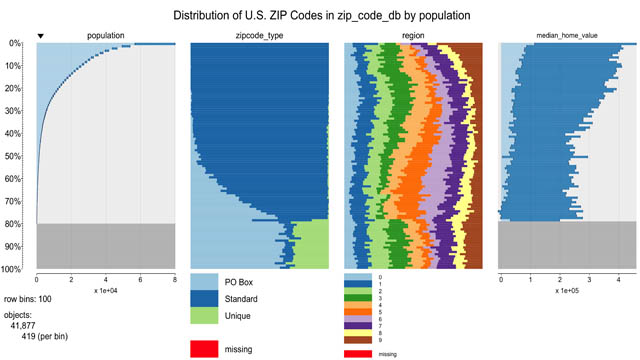
zipcodeR contributes to the R data science ecosystem by integrating multiple open-source datasets and official government crosswalk files to provide data on over 41,000 ZIP codes. These datasets are suitable for integration into larger projects via datasets and wrapper functions.
In addition to making these data sources available for integration, zipcodeR includes a suite of functions for programmatically retrieving data on ZIP codes by U.S. state, city, county, time zone, and other search parameters to support the rapid analysis of data. It allows searching of all ZIP codes located in a specific radius around a given coordinate pair with a single function call in R. These features make it possible to easily map zip-code level data without depending on external geocoding APIs. This makes it especially useful for working with restricted datasets that must not be sent outside of internal networks.
Since the package’s initial release in late 2020, zipcodeR has enabled the rapid prototyping of research and data science projects and has been implemented in a diverse range of R projects. It has been used to create an income tax dashboard that shows economic data by ZIP code. It was used to create composite metrics of data collected during the COVID-19 pandemic, a study of physician mental health, and an analysis of how equitable COVID-19 vaccine distribution was in the state of Texas. Additionally, there are several peer-reviewed manuscripts from other institutions currently under review that has implemented zipcodeR.
zipcodeR has been adopted in academia for courses and projects in data science and urban informatics. Students used it in a project exploring the relationships between COVID-19 case counts and election data. The package was used to analyze a program evaluation at a university cancer center. On a technical level, it has been used to support the analysis of commonly available administrative data and eliminating repetitive tasks for R users seeking to gain experience with geospatial analysis.
The package has now had three major iterations published on CRAN. It is becoming more comprehensive as additional user feedback has been incorporated into the software. Further contributions from the community are welcome. While the package is relatively feature-complete at this stage, future iterations may see the integration of additional ZIP code crosswalk datasets available from the U.S. federal government, as well as the improvements to the existing functions. This will add to increased efficiency and broader applicability to research workflows.
As open-source software, the source code of the package is developed in public via a GitHub repository and further contributions from the academic community are welcome.