
by Michael L. Lahr for New Jersey Policy Lab
What is the status of New Jersey housing markets? The bottom line has been more or less the same since June 2020: double-digit price growth prompted by low inventory and depressed interest rates. Have they peaked? That is a tougher call. For sure, the number of home sales has been falling statewide. But it seems likely that home prices will continue to rise. This is because the available stock of both single-family and townhouses for sale has been progressively falling since July 2021 when it reached a pandemic peak. But even that peak was close to a third of numbers ten years prior.
One reason is that homeowners opted to stay in place because a “good buy” became increasingly difficult find. While income per capita in the state rose 5.4%,[1] the median home sales price in the New Jersey rose by close to double that pace (10%) from November 2020 to November 2021.[2] So, on average, the price received for a single-family home in the state drifted upward from about 95% of list price—the rule of thumb from April 2013 through May 2020—to 103% by June 2021 when the buying frenzy peaked.[3] Even the average amount of time that a home was on the market dropped precipitously—from 75 days in January 2020 to less than 30 days by July 2021.[4] Thus, a typical single-family home in New Jersey required a household income that was 125% of the state median for most of the year 2021, substantially less than 150% above the state median household income at which it tended to peak annually since 2012.[5]
Figure 1: Monthly Sales of Existing Homes in New Jersey:
Average Price and Number of Closings[6]
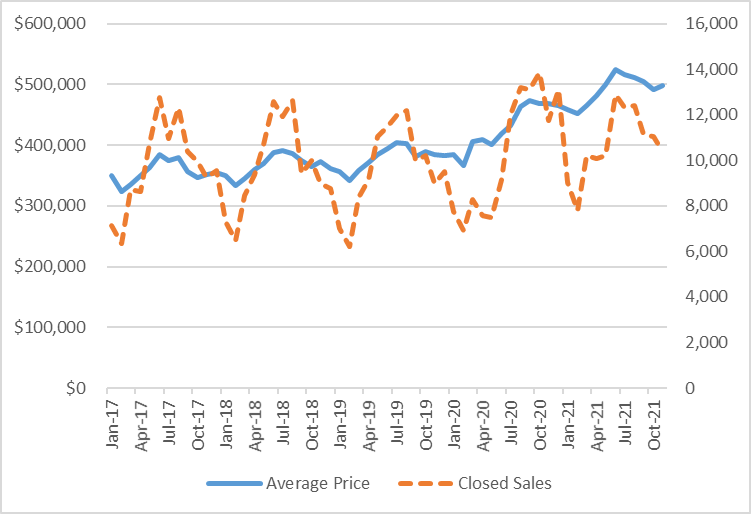
The dotted line for the number of closed sales in Figure 1 displays the seasonality of the market for existing homes in New Jersey. Note the downstroke in 2020 sales that persists for three months beyond the typical annual March lull. Note further that the rest of 2020 appears to compensate for that pent-up demand with sales of existing homes strong through November 2020 when the market is typically in sharp decline. And while, month over month, the number of sales for 2021 was lower than in 2020, the numbers are not much unlike those that existed pre-pandemic.
Existing home prices, however, started rising in April 2020 and never really tailed off substantially; although they did wane somewhat toward the end of 2021. Indeed, over the first year of the pandemic the average price of existing homes in New Jersey rose more than 20%. Since then, the growth of existing home prices subdued according to New Jersey Association of Realtors, reaching an average near $497,000 in November 2021, just 6.3% higher than that which was recorded twelve months earlier. Zillow, which tracks prices only for the middle tier of homes, suggests they rose 16.4% in the year ending December 2021 when the average price in the state indexed at something close to $432,000, which is very close to the state’s median home sales price of $440,000.[7]
Figure 2: Quarterly Sales of New Homes in New Jersey: Average Price and Sales Volume[8]
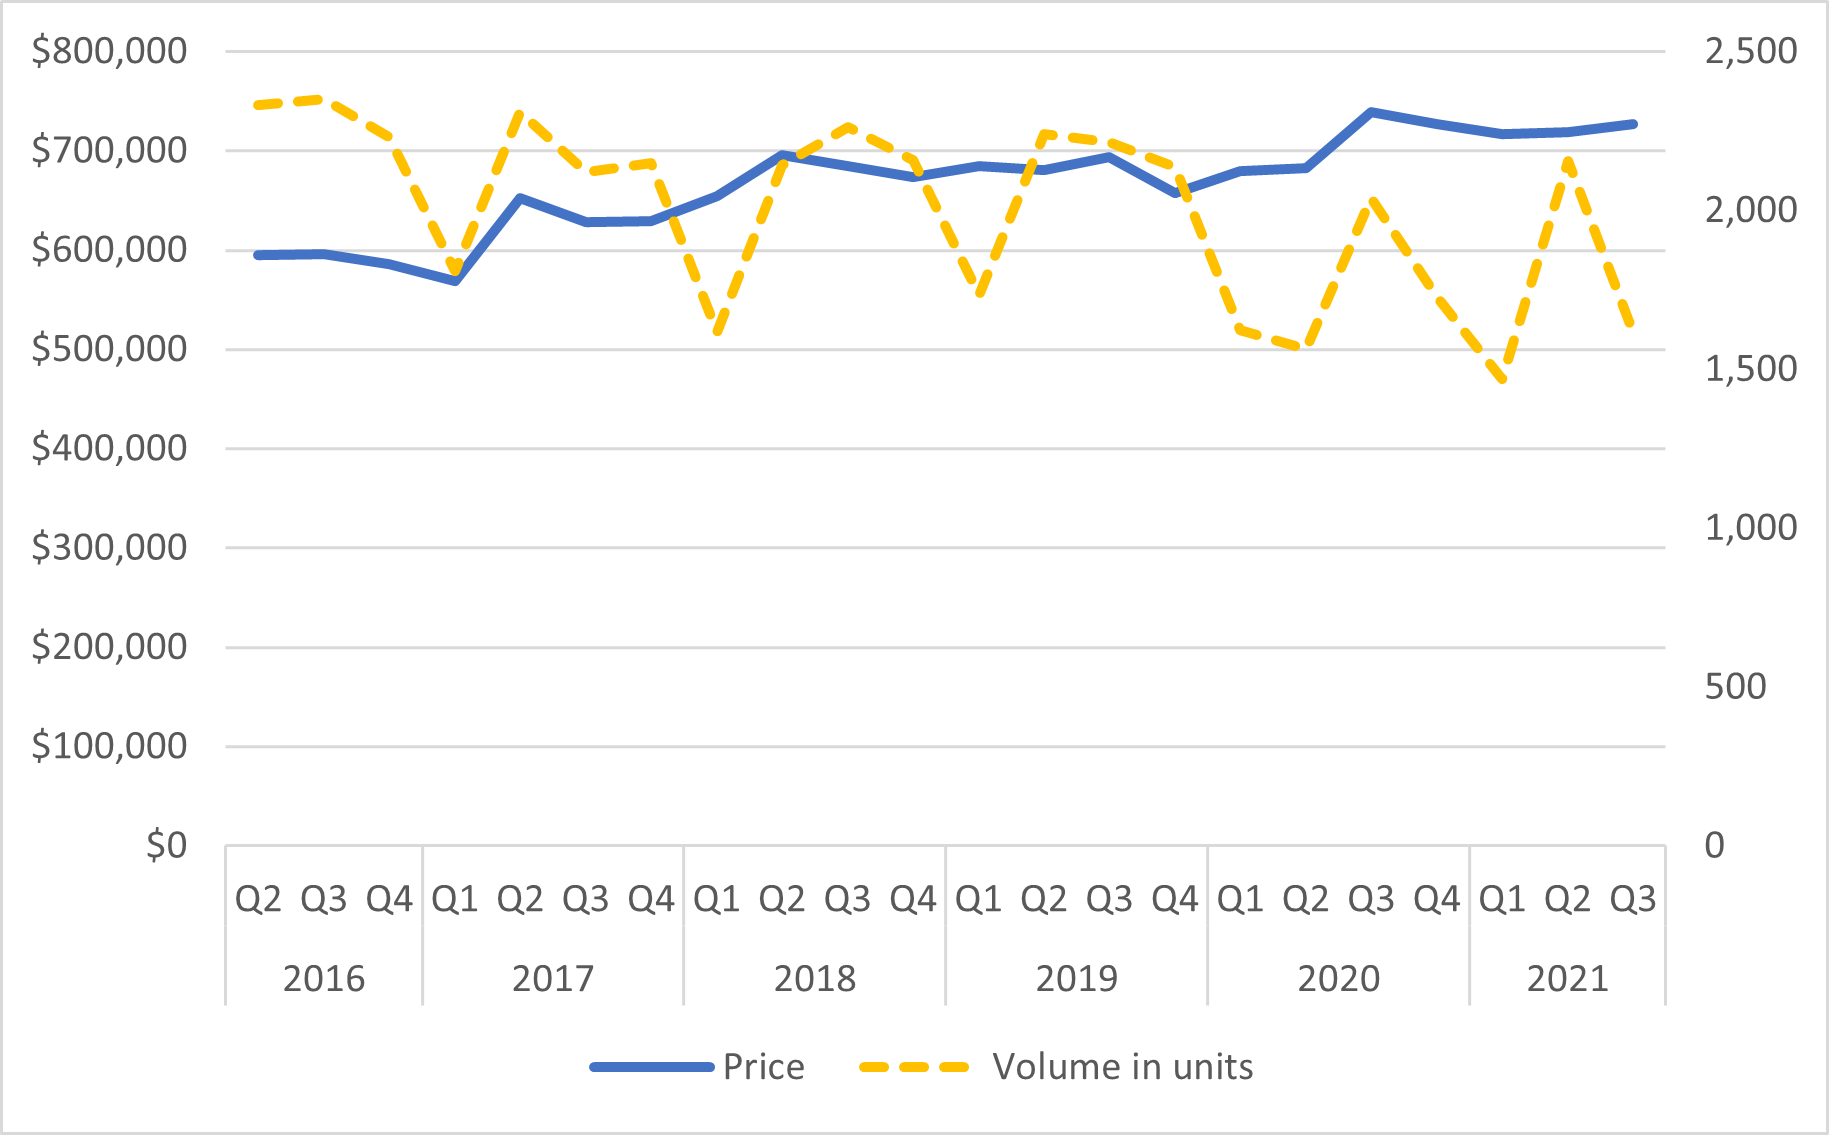
The situation for new home sales in New Jersey is less pronounced, both with regard to a decline of available stock for sale as well as with respect to prices. But it does follow a pattern of less stock and higher prices (see Figure 2). In fact, some of the supply chain issues present elsewhere in the U.S. for new homes appear not to have affected the state’s market. The jump in new home prices mostly occurred over the third quarter of 2020, following release from the most severe constraints of pandemic lockdown in the state. Since then, they have moderated slightly.
Figure 3: Single- and Multi-family Housing Permits Issued in New Jersey, Quarterly[9]
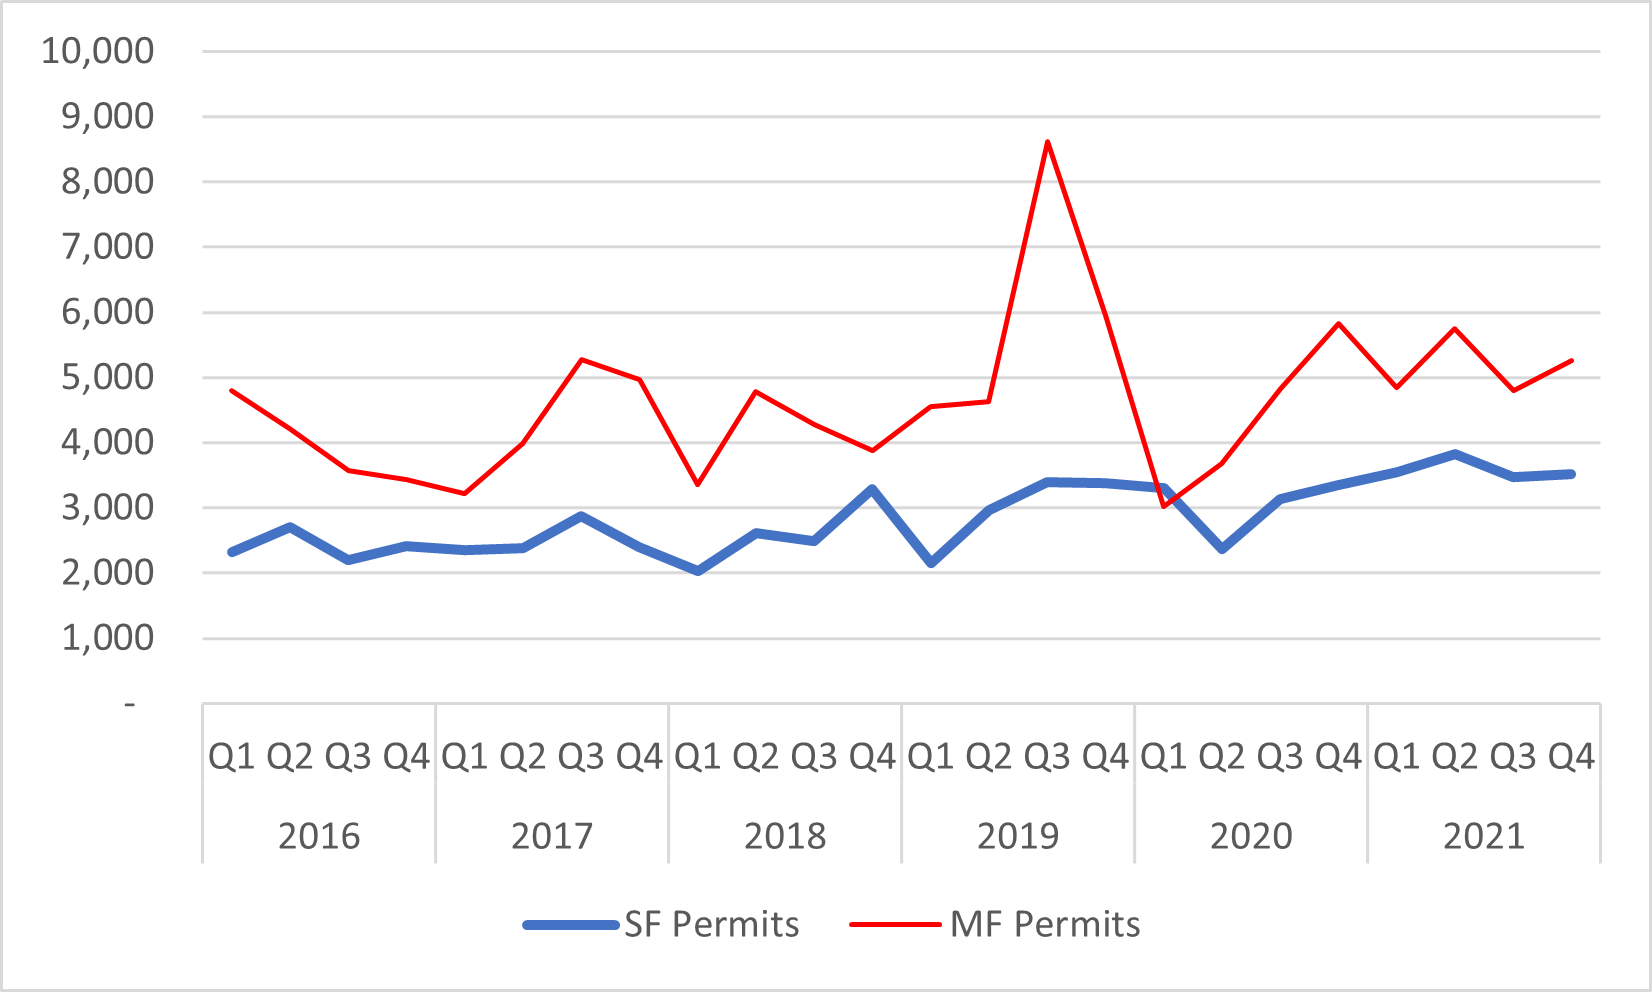
So, what are developers doing to relieve the pressure? The graph in Figure 3 of housing permits issued by New Jersey local governments suggests “not much.” It takes 18 to 24 months for a new unit to be constructed in the best of times, and the potential for new housing units remains close to pre-pandemic levels. That is, the possible additional supply of new housing units is not keeping pace with the loss of salable inventory.
In summary, New Jersey remains a home seller’s market. The supply of available inventory to purchase is declining, the time that homes are listed is much shorter, and buyers are often paying more than listing price. This last point is a phenomenon that has rarely existed statewide, and it has materialized statewide as evidenced in suburban Bergen County in the north as well as relatively rural Cumberland County in the south.[10] It does appear, however, more-modestly priced homes—those priced near the median—are getting the most market attention.